
340
Using the Review Workspace
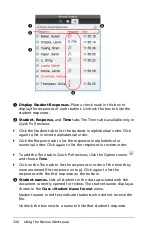
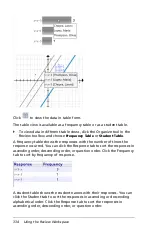
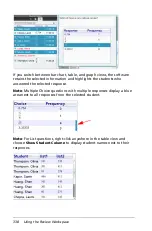
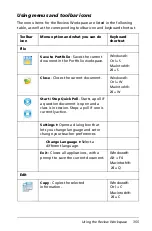
5. The Data View pane updates the graph view with the shapes you
selected.
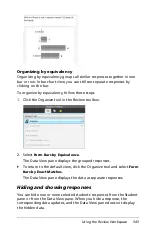
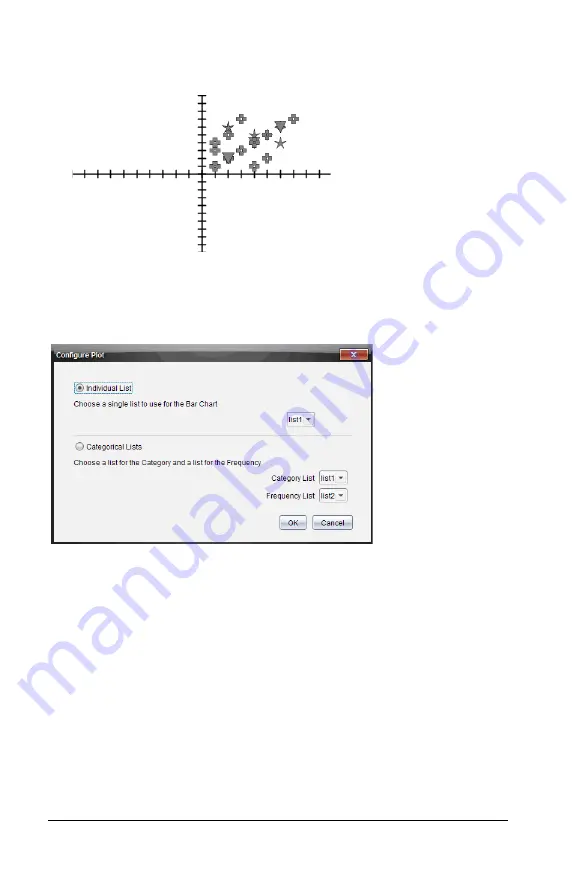
When you change plot list setting from the graph view and then change
to bar chart view, the software asks you to choose the lists to display in
the bar chart. You can choose an individual list, or a list for the Category
and a list for the Frequency.
`
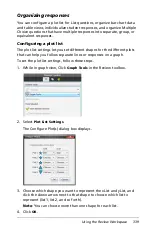
Mark your selections and click
OK
.
If you click
Cancel
, the software displays the bar chart as an individual
list, using list1 as the default.
You can configure the plot list at any time while in bar chart view.
`
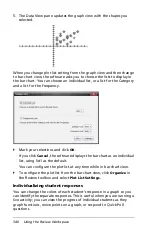
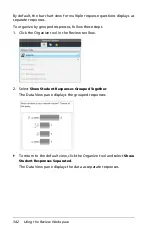
To configure the plot list from the bar chart view, click
Organize
in
the Review toolbox and select
Plot List Settings
.
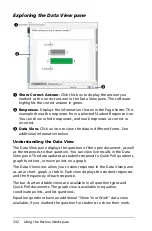
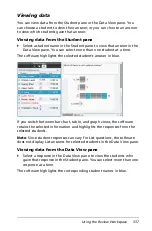
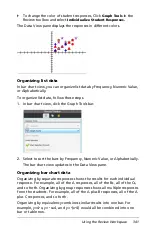
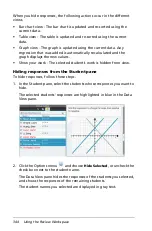
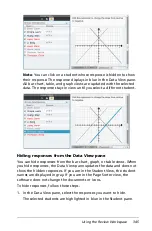
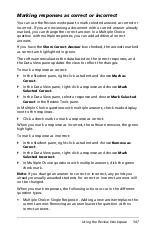
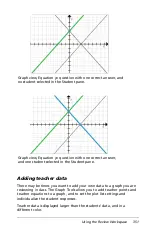
Individualizing student responses
You can change the colors of each student’s response in a graph so you
can identify the separate responses. This is useful when you are running a
live activity; you can view the progress of individual students as they
graph functions, move points on a graph, or respond to Quick Poll
questions.
Summary of Contents for TI-Nspire
Page 38: ...26 Setting up the TI Nspire Navigator Teacher Software ...
Page 46: ...34 Getting started with the TI Nspire Navigator Teacher Software ...
Page 84: ...72 Using the Content Workspace ...
Page 180: ...168 Capturing Screens ...
Page 256: ...244 Embedding documents in web pages ...
Page 336: ...324 Polling students ...
Page 374: ...362 Using the Review Workspace ...
Page 436: ...424 Calculator ...
Page 450: ...438 Using Variables ...
Page 602: ...590 Using Lists Spreadsheet ...
Page 676: ...664 Using Notes You can also change the sample size and restart the sampling ...
Page 684: ...672 Libraries ...
Page 714: ...702 Programming ...
Page 828: ...816 Data Collection and Analysis ...
Page 846: ...834 Regulatory Information ...
Page 848: ...836 ...


