


Sensing Solutions EVM GUI
34
SNOU144 – December 2016
Copyright © 2016, Texas Instruments Incorporated
LDC2114 Evaluation Module for Inductive Touch Inductance to Digital
Converter
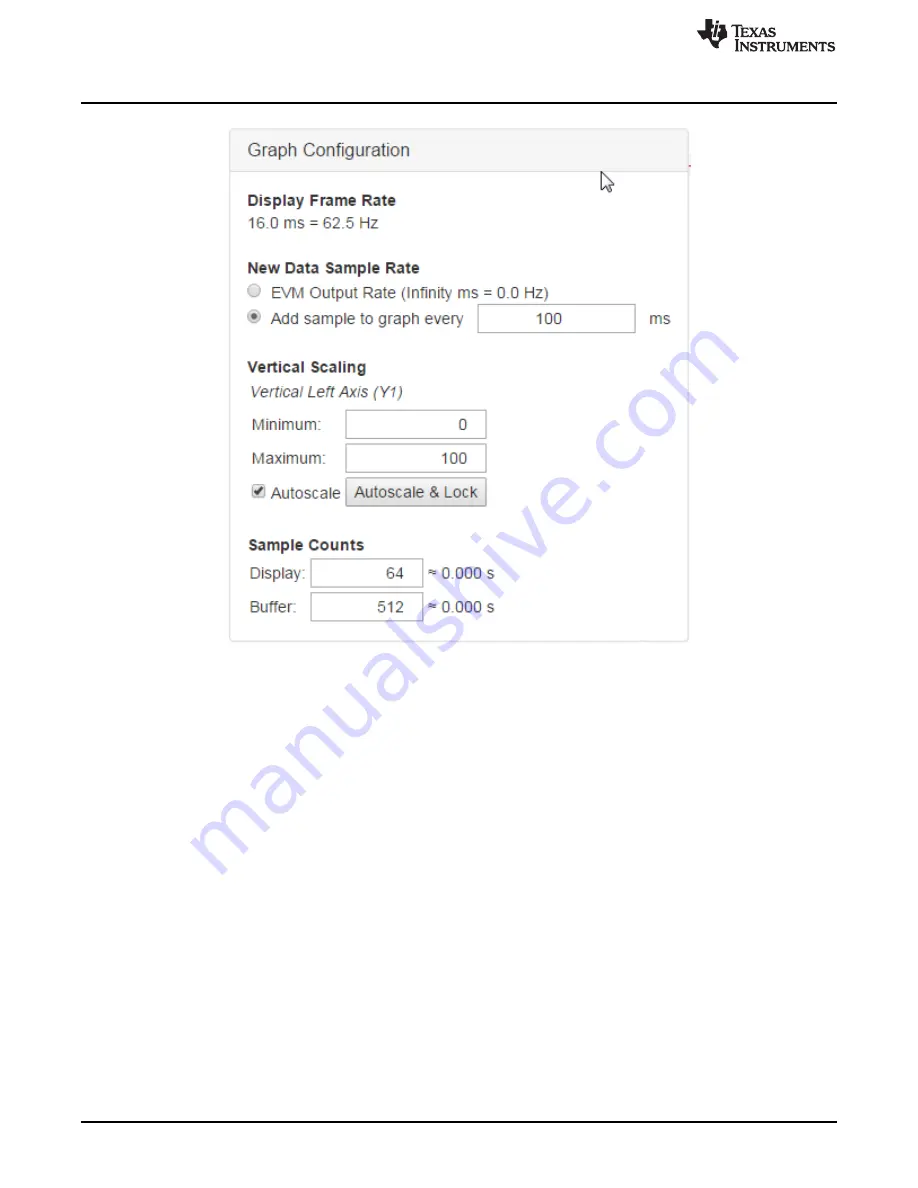
Figure 34. Graph Configuration Button on Data Streaming Page
The configuration window displays the actual frame rate of the graph, the rate at which data is added to
the graph, the vertical scaling, and the sample buffer size. The display rate is the rate at which the graph
updates on the computer display and is not configurable. It is automatically optimized by the GUI.
The
New Data Sample Rate
allows the user to choose when new data is added to the graph. Selecting
EVM Output Rate
will display data on the graph as fast as is available from the EVM. This should not be
confused with the actual sampling rate of the device on the EVM which could be different. The
Add
sample to graph every ... ms
will add a new sample to the graph at the specified rate.
The
Vertical Scaling
allows the user to either manually set the minimum and maximum values of the y-axis
on the graph or use auto-scaling. The
Autoscale & Lock
button scales the graph based on the data of the
current display and then locks those vertical scaling settings.
The
Sample Counts
allows the user to specify the number of samples displayed on the graph and the total
number of samples stored in the buffer. Please note the buffer size does not affect data logging to a file.
To hide the configuration window, click the
Hide Graph Configuration
button.
4.8.6
Navigating the Data Streaming Buffer
The Sensing Solutions EVM GUI stores a buffer of data samples and then displays a subset of those
samples. The data buffer can be navigated using the horizontal slider below the graph. To show more
samples on the graph, click either the slider on the left or right side of the green bar and drag it closer or
further from the other slider. The number of samples displayed is shown between the left and right sliders
in the green bar.