TSW1250 GUI
www.ti.com
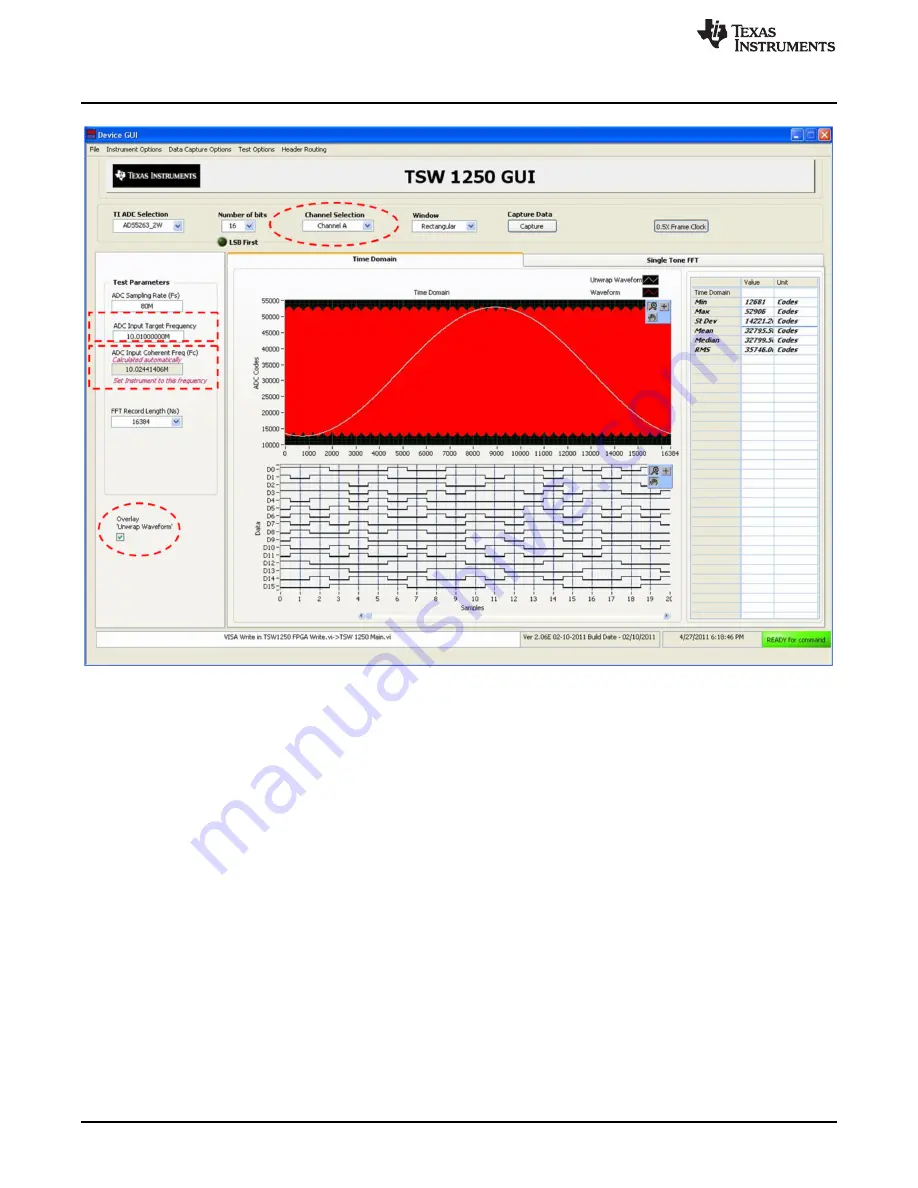
Figure 14. Sine Wave Data Capture
•
Frequency Domain:
–
Select the Single tone FFT tab in the GUI.
–
The fft graph shows the spectrum of the captured sine wave data
16
ADS5263EVM Evaluation Module
SLAU344
–
May 2011
Submit Documentation Feedback
Copyright
©
2011, Texas Instruments Incorporated


