


TI-83 Plus
Activities
566
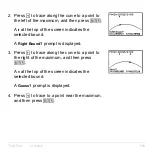
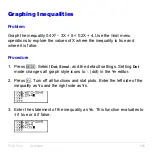
Graphing Inequalities
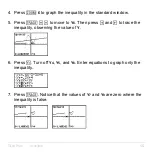
Problem
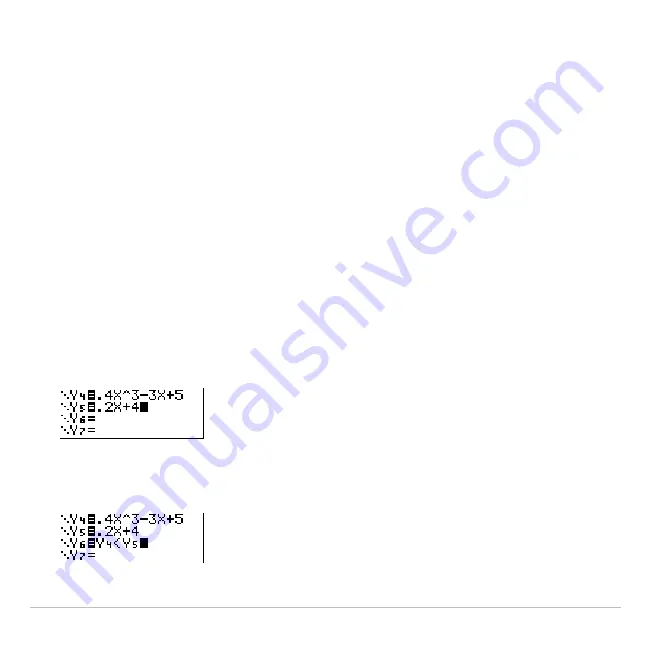
Graph the inequality 0
.
4X
3
N
3X + 5 < 0
.
2X + 4. Use the
TEST
menu
operations to explore the values of X where the inequality is true and
where it is false.
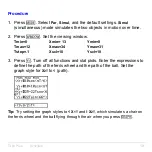
Procedure
1. Press
z
. Select
Dot
,
Simul
, and the default settings. Setting
Dot
mode changes all graph style icons to
í
(dot) in the
Y=
editor.
2. Press
o
. Turn off all functions and stat plots. Enter the left side of the
inequality as
Y
4
and the right side as
Y
5
.
3. Enter the statement of the inequality as
Y
6
. This function evaluates to
1
if true or
0
if false.
Summary of Contents for 83PL/CLM/1L1/V - 83 Plus Calc
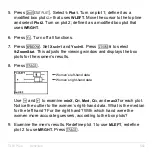
Page 407: ...TI 83 Plus Inferential Statistics and Distributions 404 Input Calculated results Drawn results...
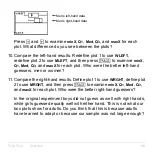
Page 412: ...TI 83 Plus Inferential Statistics and Distributions 409 Data Stats Input Calculated results...
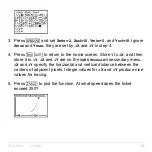
Page 454: ...TI 83 Plus Applications 451 tvm_FV tvm_FV computes the future value tvm_FV PV PMT P Y C Y...