

TI-83 Plus
Function Graphing
134
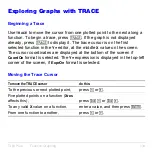
Exploring Graphs with TRACE
Beginning a Trace
Use
TRACE
to move the cursor from one plotted point to the next along a
function. To begin a trace, press
r
. If the graph is not displayed
already, press
r
to display it. The trace cursor is on the first
selected function in the
Y=
editor, at the middle
X
value on the screen.
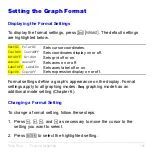
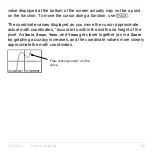
The cursor coordinates are displayed at the bottom of the screen if
CoordOn
format is selected. The
Y=
expression is displayed in the top-left
corner of the screen, if
ExprOn
format is selected.
Moving the Trace Cursor
To move the TRACE cursor
do this:
To the previous or next plotted point,
press
|
or
~
.
Five plotted points on a function (
Xres
affects this),
press
y
|
or
y
~
.
To any valid
X
value on a function,
enter a value, and then press
Í
.
From one function to another,
press
}
or
†
.
Summary of Contents for 83PL/CLM/1L1/V - 83 Plus Calc
Page 407: ...TI 83 Plus Inferential Statistics and Distributions 404 Input Calculated results Drawn results...
Page 412: ...TI 83 Plus Inferential Statistics and Distributions 409 Data Stats Input Calculated results...
Page 454: ...TI 83 Plus Applications 451 tvm_FV tvm_FV computes the future value tvm_FV PV PMT P Y C Y...