Function Graphing 3-5
8303FUNC.DOC TI-83 international English Bob Fedorisko Revised: 02/19/01 12:16 PM Printed: 02/19/01 1:35
PM Page 5 of 28
To display the
Y=
editor, press
o
. You can store up to 10
functions to the function variables
Y
1
through
Y
9
, and
Y
0
.
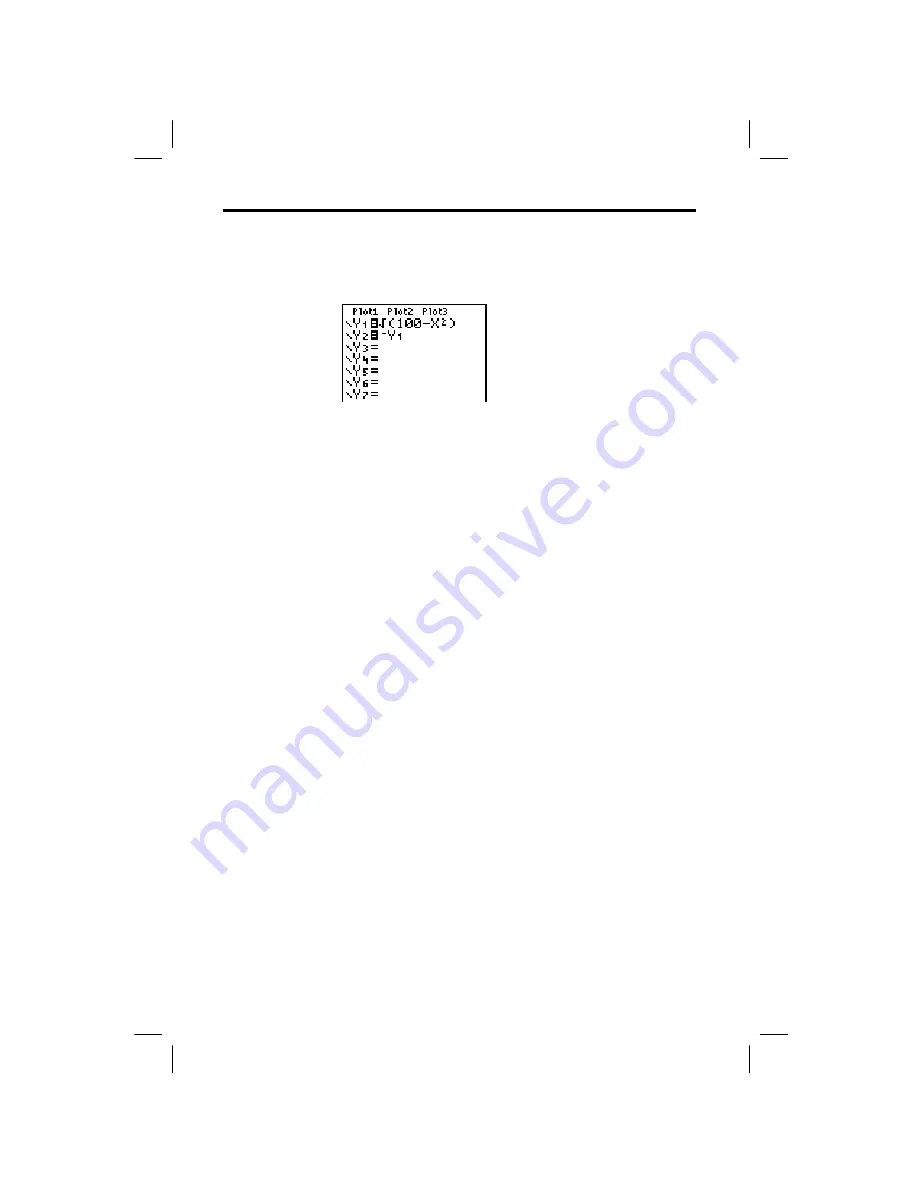
You can graph one or more defined functions at once. In
this example, functions
Y
1
and
Y
2
are defined and selected.
To define or edit a function, follow these steps.
1. Press
o
to display the
Y=
editor.
2. Press
†
to move the cursor to the function you want to
define or edit. To erase a function, press
‘
.
3. Enter or edit the expression to define the function.
•
You may use functions and variables (including
matrices and lists) in the expression. When the
expression evaluates to a nonreal number, the value
is not plotted; no error is returned.
•
The independent variable in the function is
X
.
Func
mode defines
„
as
X
. To enter
X
, press
„
or press
ƒ
[
X
].
•
When you enter the first character, the
=
is
highlighted, indicating that the function is selected.
As you enter the expression, it is stored to the variable
Y
n
as a user-defined function in the
Y=
editor.
4. Press
Í
or
†
to move the cursor to the next
function.
Defining Functions
Displaying
Functions in the
Y= Editor
Defining or
Editing a
Function


