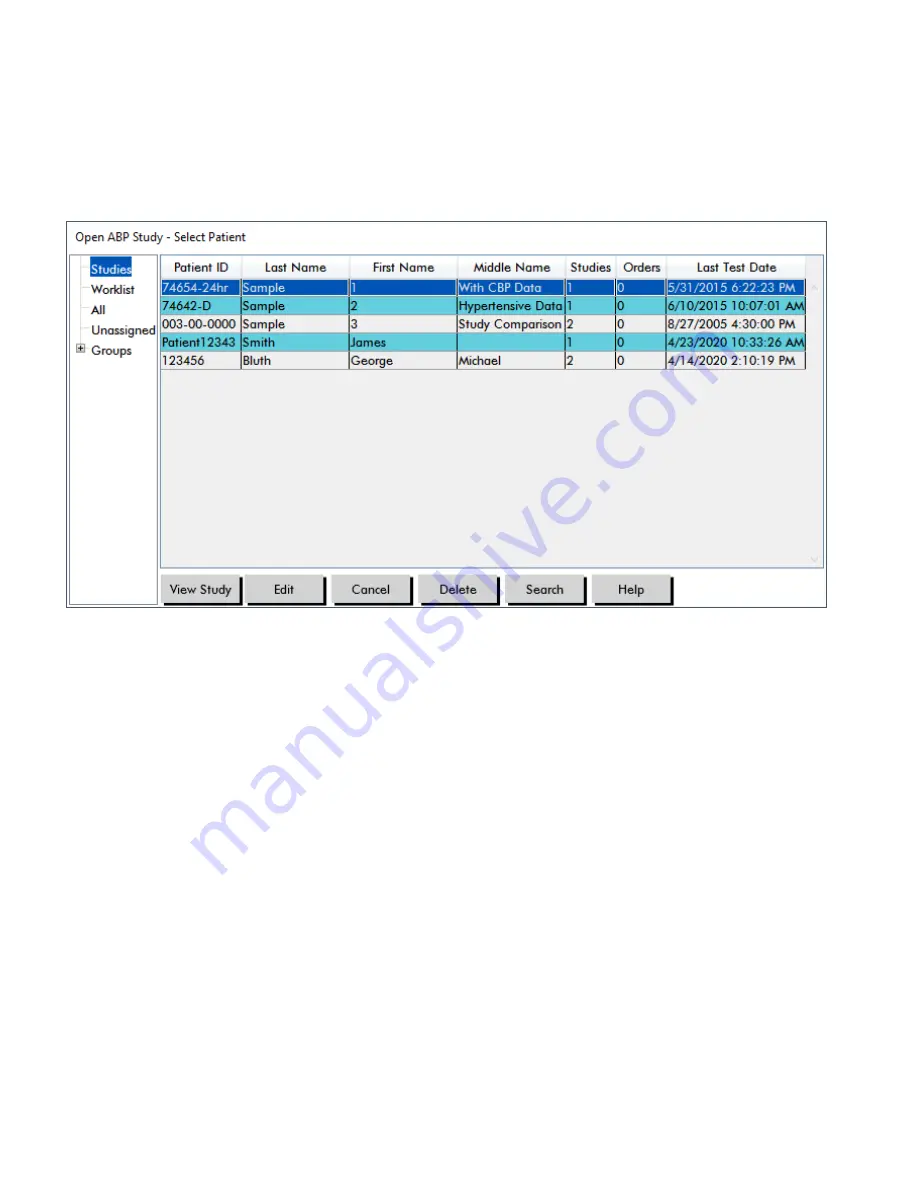
open. Select the patient whose BP data you wish to review by clicking on the patient’s name.
3.
Click
OK
.
4.
If the patient has more than one ABP study, a second dialog box,
Choose Date
, appears. Select a
study date and click
OK
. The patient’s data appears in the display area. You can now review the BP
study or print a report.
Figure 8:
BP Data View
Patients, Studies and Orders
Patient information and BP data is arranged into Patients, Studies and Orders.
•
Patient
contains patient ID, name and patient demographic information such as age, height and ad
-
dress.
•
Study
contains BP data and study specific patient information such as history and medication.
•
Order
contains study specific information entered by the user or imported prior to the completion of a
study, for example, if a reason for test is provided before a study is retrieved from the monitor.
Each study in a patient file contains data that is displayed in the views accessed by the tabs at the bottom
of the application. The study information bar located toward the top of the view identifies the patient name,
patient ID, patient age (at the time of the study) and the study date of the displayed file.
Tabs and their contents.
•
ABP Data:
ABP measurement data from the monitor and relevant graphs.
•
Patient Info:
Patient name, ID, contact information, and physical description.
•
Physician Info:
Patient history, clinical information, and interpretation.
•
Statistics:
Statistical analysis of the ABP study.
•
Dose Response Statistics
: Statistical analysis for dose response sequences.
•
Time-Slice Statistics:
Statistical analysis of specific user-defined time windows.
Page 30 of 79
80-0062-00-RevL 2020-9-14


