


1.
Navigate to
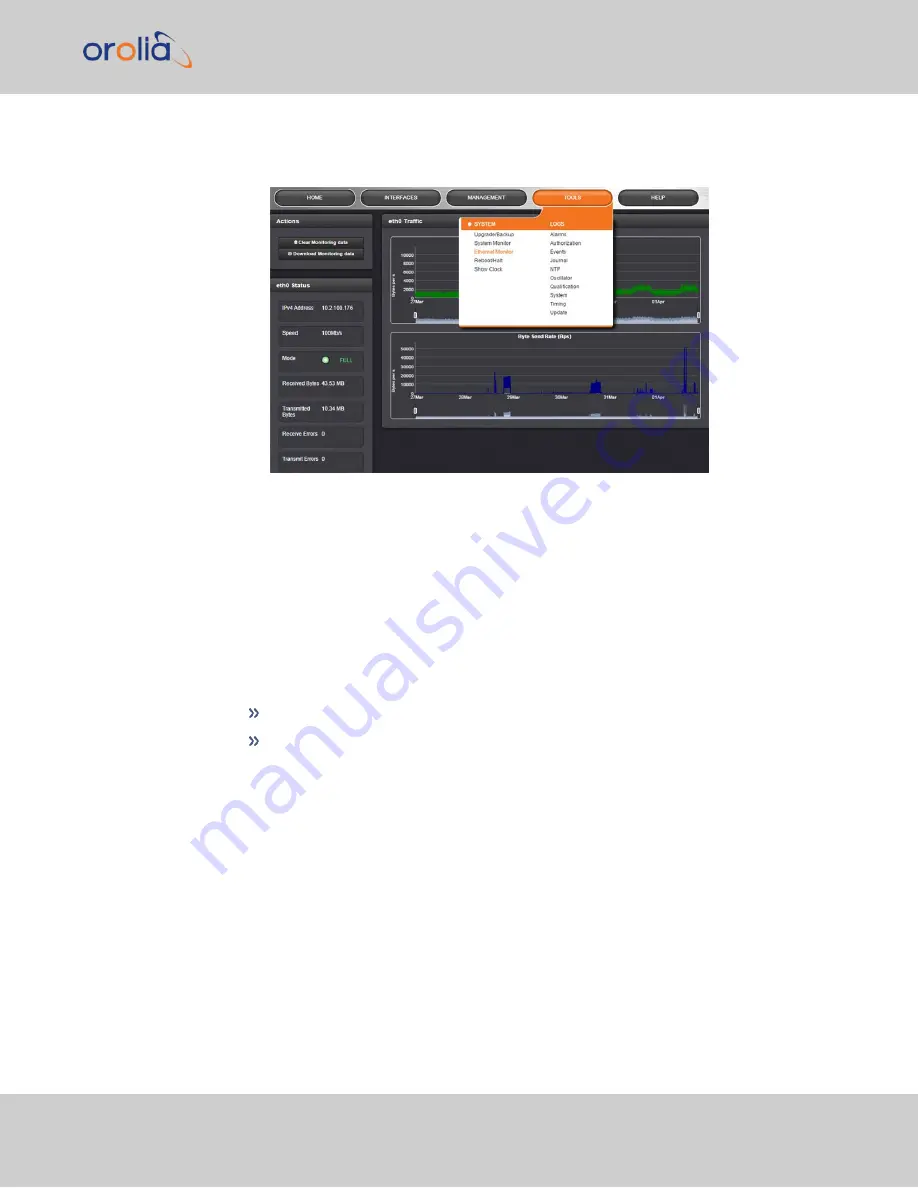
TOOLS > SYSTEM: Ethernet Monitor
. The Ethernet monitoring
screen opens:
The data displayed is linked to a specific Ethernet port e.g., ETH0. If you enable addi-
tional Ethernet ports, their throughput data will also be displayed.
In the
Traffic
pane on the right the traffic throughput in Bytes per second is displayed
in two graphs. Drag the handles at the bottom of the graphs to zoom in on a particular
time frame.
In the
Actions
panel on the left, you can clear or download monitoring data.
In the
Status
panel on the left, information pertaining to the given Ethernet port is dis-
played, including throughput statistics and error statistics. The Mode field indicates
which transmission mode is being used for the given Ethernet port:
FULL
duplex, or
HALF
duplex.
Note that the Mode is auto-negotiated by VelaSync. It can be changed only via the
switch VelaSync is connected to, not by using the VelaSync Web UI.
4.7.1.3
NTP Status Monitoring
VelaSync's
NTP Status Summary
provides a means to monitor NTP status and per-
formance parameters relevant to your VelaSync at a glance.
4.7 Quality Management
CHAPTER
4
•
VelaSync User's Manual Rev. 3
191
Summary of Contents for VelaSync 1225
Page 2: ......
Page 4: ...Blank page II VelaSync User s Manual...
Page 12: ...BLANK PAGE X VelaSync User s Manual TABLE OF CONTENTS...
Page 28: ...16 CHAPTER 1 VelaSync User s Manual Rev 3 1 7 The VelaSync Web UI...
Page 34: ...BLANK PAGE 1 9 Regulatory Compliance 22 CHAPTER 1 VelaSync User s Manual Rev 3...
Page 104: ...BLANK PAGE 2 11 Configuring PTP 92 CHAPTER 2 VelaSync User s Manual Rev 3...
Page 251: ...Server management System specifications VelaSync User s Manual 239 APPENDIX...
Page 267: ...VelaSync User s Manual 255 APPENDIX...