background image

112

M2 Scope/Meter

M2 Scope/Meter Remote Operation

Figure 8-26 

Remote functions setting

When the M2 Scope/Meter is connected to the Diagnostic Tool, all soft key controls on the M2 
Scope/Meter are inoperative, as all controls of the M2 Scope/Meter are transferred to the 
Diagnostic Tool. Turning the Rotary Switch off of the Remote Functions position returns 
control to the M2 Scope/Meter and the soft keys regain their functionality.M2 Scope/Meter

2. Select 

Scope Multimeter

 on the Diagnostic Tool.

3. Select the desired 

Scope Multimeter

 function, (Lab Scope, Digital Multimeter, etc.).

The M2 Scope/Meter screen will change to indicate the devices are communicating, see 

Remote Working Range / Communication Screens

 on page 113.

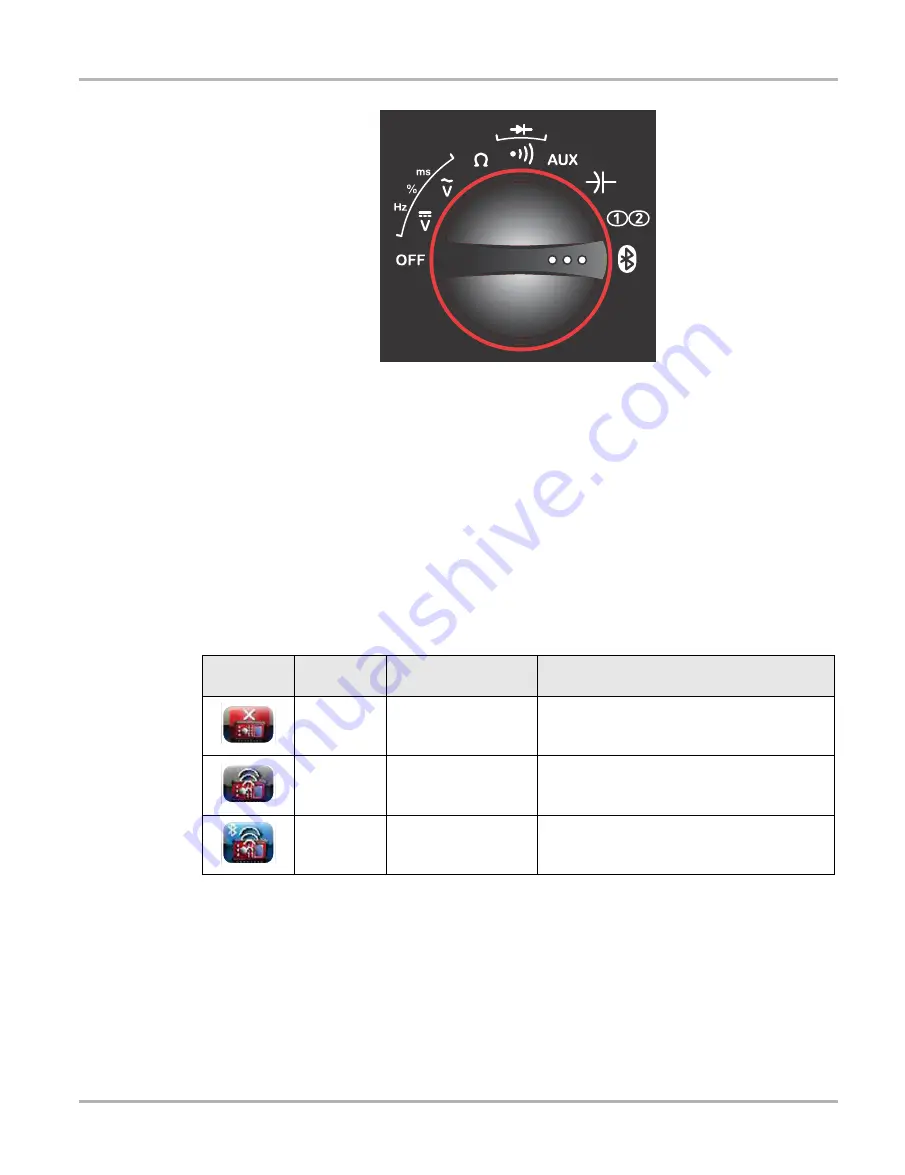
The M2 Scope/Meter Diagnostic Tool Hardware Status indicators in the lower-right corner of 
the Home screen also provide a quick reference to device status. The background color of the 
status indicator icon represents the condition of the wireless connectivity. Icon status is shown 
in the table below:

4. Connect the M2 Scope/Meter leads as needed. For M2 Scope/Meter operation, see 

M2 

Scope/Meter Operations

 on page 91 and for Diagnostic Tool Scope Multimeter operation, see 

Scope Multimeter Operations

 on page 114.

Hardware 

Icon

Background 

Color

Condition

Action

Red

Not Paired

Pair the M2 to the Diagnostic Tool. See 

Pairing 

the M2 Scope/Meter

 on page 108 for 

instructions.

Grey

Paired, but Not 
Communicating

You may have moved out of range. Move the 
M2 closer to the Diagnostic Tool to reestablish 
communications. 

Blue

Paired, and 
Communicating

Hardware status is good and Bluetooth is 
communicating. 

Summary of Contents for VERDICT

Page 1: ...User Manual EAZ0063L05G Rev E 5 ...

Page 2: ...s in any way the liability to the customer or to third parties Snap on reserves the right to make changes at any time without notice IMPORTANT Before operating or maintaining this unit please read this manual carefully paying extra attention to the safety warnings and precautions Contact Information North America Websites Snap on Diagnostics and Information http diagnostics snapon com Software Sub...

Page 3: ...d variations in the products that can be tested with this instrument we cannot possibly anticipate or provide advice or safety messages to cover every situation It is the responsibility of the automotive technician to be knowledgeable of the system being tested It is essential to use proper service methods and test procedures It is important to perform tests in an appropriate and acceptable manner...

Page 4: ...rate or minor injury to the operator or to bystanders Safety Message Conventions Safety messages are provided to help prevent personal injury and equipment damage Safety messages communicate the hazard hazard avoidance and possible consequences using three different type styles Normal type states the hazard Bold type states how to avoid the hazard Italic type states the possible consequences of no...

Page 5: ...11 Turning On 11 Turning Off 11 Emergency Shutdown 11 Controls and Indicators 12 Control Buttons 12 LED Indicators 13 Basic Navigation 13 Starting the ShopStream Diagnostic Suite Program 13 Home Screen Layout 14 Function Icons 14 Toolbar 15 Windows Toolbar 17 Virtual Keyboard 18 Camera Operation 20 Operating the Camera 20 Viewing Pictures 21 Wi Fi Setup 21 Chapter 4 Scanner Function 22 Demonstrati...

Page 6: ...BD II Code Check 69 Global OBD II Clear Codes 70 Readiness Monitors 70 MIL Status 71 OBD Diagnose 71 Start Communication 71 Connector Information 75 Manual Protocol Selection 75 Chapter 7 Guided Component Test Operations 76 Vehicle Identification 76 Menu Options Guided Component Test 77 Creating a Favorites List 79 Identifying a Test Vehicle 80 Operations 82 Component Information 82 Tests 83 Chapt...

Page 7: ... 10 Repair Information 136 About ShopKey Pro 136 Chapter 11 Vehicle History Operations 138 Screen Layout 138 Vehicle History Main Body Records List 138 Vehicle History Toolbar 139 Chapter 12 Data Manager Operations 144 Screen Layout 144 Navigation 145 Operations 146 My Data 146 Up 146 Open 146 New 147 Delete 148 Rename 149 Properties 150 Shortcut 150 Email 151 Viewing Saved Files 156 ShopStream Co...

Page 8: ...tarted 180 Logging In existing active account 183 Logging In existing expired account 184 About Upgrade Reminder Messages 184 Chapter 16 ShopStream Update Tool SST 185 Basic Operation 185 Manual Software Download 187 Installing Software Updates 189 Installing Software Upgrades 191 Chapter 17 Maintenance 193 Diagnostic Tool 193 Cleaning the Touch Screen 193 Calibrating the Touch Screen 193 Cleaning...

Page 9: ... items such as buttons and menu options Example Select Functions 1 1 2 Symbols The greater than arrow indicates an abbreviated set of selection instructions Example Select Utilities Tool Setup Date The above statement abbreviates the following procedure 1 Select the Utilities icon 2 Select the Tool Setup submenu 3 Highlight the Date option from the submenu 1 1 3 Terminology The term select describ...

Page 10: ...ommunication can cause damage to the ECM 1 1 5 Procedures An arrow icon indicates a procedure Example z To change screen views 1 Select View The dropdown menu displays 2 Select an option from the menu The screen layout changes to the format you selected 1 1 6 Hyperlinks Hyperlinks or links that take you to other related articles procedures and illustrations are available in electronic documents Bl...

Page 11: ...or for the system Scan Module wireless device for accessing vehicle data M2 Scope Meter wireless device for sampling circuits and signals This manual describes the operation of these three devices and how they work together to deliver diagnostic solutions 2 1 Features and Specifications 2 1 1 Diagnostic Tool 1 Audio Speaker 2 Battery Status Indicator LED light emitting diode 3 Microphone 4 Hard Dr...

Page 12: ...nput Jack 5 SD secure digital Card Port 6 Mini USB Client Jack Figure 2 2 Model D7 side views 1 Battery Compartment Cover 2 Kensington Lock standard security device connection device not included 3 Stylus 4 Camera Lens 5 Collapsible Stand closed 6 Docking Station Connection not shown Figure 2 3 Model D7 back view HIW 6LGH 5LJKW 6LGH ...

Page 13: ...System Microsoft Windows Embedded Standard SP3 Communications 802 11 b g n Wireless Wireless Bluetooth 2 0 Technology Battery Lithium Ion Smart Battery Pack Approximate 3 5 hour run time Approximate 3 hour charge time unit not operating Approximate 4 hour charge time with unit operating Power Supply Supply Rating 19 VDC 3 24A DC Operating Voltage 10 to 32VDC Width 9 9 in 252 mm Height 6 8 in 173 m...

Page 14: ... power supply When connected to the Diagnostic Tool the AC DC power supply also recharges the internal rechargeable battery pack Vehicle Power The Diagnostic Tool can be powered from a standard 12VDC vehicle power port using the Diagnostic Tool DC power port adapter The DC power port adapter connects to the DC power supply jack on the left side of the Diagnostic Tool Docking Station Optional The D...

Page 15: ...al serial bus USB jack remove protective hand grip for access Figure 2 4 Scan Module Wireless Communication The Scan Module is a wireless communications device that transmits vehicle data to the Diagnostic Tool without a physical connection A signal lost due to moving out of range automatically restores itself when the Diagnostic Tool is brought closer to the Scan Module The Scanner sounds a tone ...

Page 16: ...cable supplied with your kit Item Description Specification Communications Wireless Bluetooth 2 0 Technology USB Power 5V 500mA Data Cable Connector Power 8V to 32V Maximum 12 Watts Width 8 04 in 204 3 mm Height 3 82 in 97 mm Depth 1 66 in 42 1 mm Weight 0 9 lb 0 408 kg Operating Temperature Range ambient At 0 to 90 relative humidity non condensing 32 to 113 F 0 to 45 C Storage Temperature ambient...

Page 17: ...e Meter M2 Scope Meter Wireless Communication The M2 Scope Meter is a digital graphing multimeter and wireless communications device The unit can be used as a stand alone meter or configured to transmit data to the D7 Diagnostic Tool without a physical connection The working range of the transmitter is about 30 feet 9 14 m A signal lost due to moving out of range automatically restores itself when...

Page 18: ... Meter is also provided The power supply connector that inserts into the M2 Scope Meter is longer than the power supply connector that is used for the Diagnostic Tool Item Description Specification Display Color graphical display Battery Pack 4 1 2V Ni Mh nickel metal hydride Width 9 125 in 231 8 mm Height 4 25 in 107 9 mm Depth 2 00 in 50 8 mm Weight 1 9 lb 0 86 kg Operating Temperature Range amb...

Page 19: ...hutting down the Diagnostic Tool A warning message displays if you attempt to shut down while the Scan Module is communicating with a vehicle Forcing a shut down while communicating may lead to ECM problems on some vehicles Exit the Scan Module before turning off Before turning the Diagnostic Tool off it is highly recommended to back up personal and saved data to a USB mass storage device on a reg...

Page 20: ...tool operations are controlled through the touch screen Table 3 1 Diagnostic Tool control buttons Name Button Description S Shortcut Button A function button that provides a shortcut for capturing a screen image Directional Buttons Moves the cursor or highlight on the display screen up down right or left Enter Button Selects a highlighted item or returns the display to the previous screen Camera B...

Page 21: ...es when the central processing unit CPU is reading or writing to the hard disk drive HDD 3 3 Basic Navigation 3 3 1 Starting the ShopStream Diagnostic Suite Program The ShopStream Diagnostic Suite program is automatically started when the Diagnostic Tool is turned on through the Windows start up folder function After the program has started the ShopStream Diagnostic Suite Home Screen displays see ...

Page 22: ...ief descriptions of the available Function icons which operations are available depends upon the individual configuration of your VERDICT system Use the stylus or your finger tip to select from the Function icons 1 2 3 Table 3 2 sheet 1 of 2 Name Icon Description Scanner Configures the Diagnostic Tool to operate as a scan tool See Scanner Function on page 22 OBD Direct Allows you to perform generi...

Page 23: ...zation system for saved data files See Data Manager Operations on page 144 Help Opens the on line help for the system See Help Operations on page 169 System Settings Establishes and manages wireless connections to peripheral devices such as the Scan Module and the M2 Scope Meter See System Settings Operations on page 170 Exit Closes the VERDICT Diagnostic Tool software and returns the display to t...

Page 24: ... Tool kit The Important Safety Instructions document should be read and understood prior to using the Diagnostic Tool Help A variety of utilities and additional resources are available through the Help menu Basic menu options which are available for all modules include User Manuals Version Info Activation Status User Manual This option opens this document which provides overall navigation and oper...

Page 25: ...r additional information Windows System Tray ShopStream Diagnostic Suite Programs The Windows system tray may contain standard Windows application icons e g Wireless Network Connection Status Audio volume etc and specialized application icons designed for use only on this Diagnostic Tool e g ShopStream Update Tool and Virtual Keyboard Refer to Microsoft software documentation for additional inform...

Page 26: ...con in the Windows system tray opens the Virtual Keyboard menu Menu options include Hide Virtual Keyboard minimizes the keyboard Close Virtual Keyboard closes the Virtual Keyboard program Show Virtual Keyboard displays the keyboard Settings opens the Virtual Keyboard settings window Figure 3 5 About displays the Virtual Keyboard program software version number Virtual Keyboard program selection fr...

Page 27: ...to standard display 3 Top moves the keyboard to top of screen 4 Close closes the keyboard 5 Bottom moves the keyboard to bottom of screen Figure 3 4 Virtual Keyboard shown expanded NOTE i The Virtual Keyboard can be set to open automatically when a data field or form is selected in certain applications See the Settings window Figure 3 5 for selection options Figure 3 5 Virtual Keyboard settings wi...

Page 28: ...nction is active Table 3 4 Camera icons sheet 1 of 2 Name Icon Description Photo Acts as a shutter to take a photograph of what is visible in the view finder which is the left hand portion of the screen Gallery Opens a thumbnail gallery of recently taken pictures Exit Closes the camera application and returns to the previous screen OK Displays after a picture is taken Selecting saves the photograp...

Page 29: ...d drive and can be retrieved two ways From the Diagnostic Suite select Data Manager from the Home screen then open the Camera Folder From the desktop select My Documents ShopStream Camera Folder 3 6 Wi Fi Setup Certain applications in the ShopStream Diagnostic Suite require wireless Internet connection The wireless network connection status icon is typically available from the Windows system tray ...

Page 30: ...canner Operation follow along with step by step basic vehicle scanning operations Stopping Communication and Exiting the Scanner review important Scanner exiting procedures 4 1 Demonstration Program A Scanner demonstration program is provided to help you to become familiar with Scanner operations without connecting to a vehicle Sample data and test results are provided to help you learn the menus ...

Page 31: ... when additional input is needed before proceeding There are three types of on screen messages confirmations warnings and errors Confirmation Messages Confirmation messages inform you when you are about to perform an action that cannot be reversed or when an action has been initiated and your confirmation is needed to continue When a user response is not required to continue the message displays b...

Page 32: ...anation of the Scanner toolbar icon operations Table 4 1 Scanner toolbar icons sheet 1 of 2 Name Icon Description Exit Closes the current test and returns you to the menu Back When available returns to the previously viewed screen Custom Allows you to select which parameters are displayed on the screen Alarms Allows you to set an alarm on certain data parameters when the signal goes above or below...

Page 33: ...y used for saved files z To create a custom data list 1 Select Custom on the Scanner Toolbar The parameter selection dialog box with all of the parameters selected opens Figure 4 3 2 Select the Deselect All icon to clear the highlights from the screen 3 Create a custom data list by selecting the parameters to be included Highlighting indicates a parameter that displays parameters that are not high...

Page 34: ...a screen in Graph View format see Graph View on page 28 for details NOTE i Graph View is only available when 16 or fewer parameters the number that can display on a single screen were selected for the custom list Make sure that no more than 16 parameters are highlighted if the screen displays a single graph when the Graph View icon is selected Alarms Alarms are visual indicators alongside a parame...

Page 35: ...ly be set for certain parameters If the Alarm List dialog box is empty no parameters are available and alarms cannot be set Properties The Properties icon on the Scanner Toolbar is used to configure certain characteristics of the parameter graph display Selecting opens a Properties dialog box that allows you to adjust colors settings and sweep Figure 4 5 Figure 4 5 Sample properties dialog box ...

Page 36: ...the graph Values are in sample points or frames of data A frame of data equals one complete transmission of the serial data by the electronic control module Graph View Graph View allows you to simultaneously display up to 16 parameter graphs Figure 4 6 The graphs must first be opened in the data list in order to be included when Graph View is selected from the toolbar The display defaults to a sin...

Page 37: ...e A save movie dialog box displays while data is being saved The movie is saved when the message box disappears Figure 4 7 Sample save dialog box To open saved Scanner data files from the Home screen select Data Manager Scanner Data Folder see Scanner DataViewer Operation on page 157 Print Selecting Print from the toolbar opens a standard Windows Print dialog box Select from the options as needed ...

Page 38: ...internet browser z To open a saved print file 1 Minimize the Diagnostic Suite to view the desktop 2 From the desktop select My Documents ShopStream Scanner Data Folder 3 Locate the file you wish to view 4 Double select the file to open it The internet browser and file open More Whenever the More icon appears on the toolbar it indicates that there are additional options available Selecting the More...

Page 39: ... Figure 4 10 The dropdown menu closes once a selection is made Figure 4 10 Sample data graph sweep Main Body The main body of the screen varies depending on the stage of operation The main body can show vehicle identification selections the main menu test data instructions troubleshooting information controls and other diagnostic information ...

Page 40: ... Icon Description Snapshot Arms the software to take a snapshot of vehicle data Go To Start Moves to the first frame in the data buffer Pause Suspends data capture and changes to show the Play icon Play Starts or resumes data capture and changes to show the Pause icon Go To End Moves to the last frame in the data buffer Clear Erases data in the data buffer Step Back Moves to the previous frame in ...

Page 41: ...copy of the data currently being viewed Menu options include Save opens a submenu with these options Screenshot saves a graphic image of the current screen Collected Data saves a recording of all the data currently in the buffer plus the number of frames designated after the trigger event see Properties on page 27 Print opens a submenu with these options Screen sends the current screen image to a ...

Page 42: ...lect Accept to close the dialog box and apply the changes Display BEN Selecting opens a screen with the Balco Engine Number BEN of the currently identified vehicle The BEN is used internally for data coordination and you may be asked to provide to a Customer Care representative for troubleshooting communication problems Help A variety of utilities and additional resources are available through the...

Page 43: ...vehicles Figure 4 14 Sample User s Manuals menu Select Exit to close the Help module and return to the Scanner About Scanner Hardware Version This option opens a dialog box showing the hardware version and other details about the Scanner module A Copy to Clipboard icon allows you to paste the information to a document or e mail About Scanner This option opens a dialog box that shows the software v...

Page 44: ...d an onscreen message may appear providing connection instructions 7 Select a Test to be performed Note The above information applies to most OBD II vehicles Not all vehicles support Instant ID 4 3 1 Connecting the Scan Module The Scan Module is a wireless device that is connected using the vehicle data cable to the vehicle and transmits vehicle data to the Diagnostic Tool To use the Scanner funct...

Page 45: ... entered The vehicle identification sequence is menu driven follow the screen prompts to enter the vehicle information To complete the Manual ID process and continue select Continue from the vehicle confirmation screen z Identifying a vehicle 1 Select the Scanner from the Home screen A list of vehicle manufacturers make displays Figure 4 15 Figure 4 15 Manufacturer list typical 2 Select a manufact...

Page 46: ...ristics that prevents it from communicating with the Scanner In these instances there is an alternate choice that allows you to establish communication with the vehicle OBDII EOBD Function this function allows you to connect to the OBDII equipped vehicle and perform basic OBD II or EOBD diagnostic functions see OBD Direct Operations on page 68 for additional information 4 3 3 Vehicle System Select...

Page 47: ...ively as the modules are scanned The total number of systems detected A summarized list of modules detected with DTCs totals for each Individual system module reports that include a list of the DTCs set the DTC common replaced parts graph and a direct link to SureTrack Fix It information for each specific DTC For additional information on SureTrack the Fix It and common replaced parts graph featur...

Page 48: ...r Operation Figure 4 18 Code Scan Features 1 SureTrack Common Replaced Parts Graph 2 Code Scan Summary 3 Progressive status indicator 4 Systems Summary List with DTC totals 5 Individual System DTC Reports 6 SureTrack Fix It icon ...

Page 49: ...rint from the toolbar to print the Code Summary Report Figure 4 19 Printed Code Summary Report Clear All Codes Read by Code Scan Selecting Clear All Codes Read by Code Scan erases all DTCs from all vehicle system modules that were read by Code Scan ...

Page 50: ...om the ECM This selection is found on a Codes submenu for some models Functional Tests provides specific subsystem and Guided Component Tests The tests vary depending on the manufacturer and model Actuator Tests similar to functional tests checks the operation of certain actuators such as solenoid valves and relays Memory Resets allows you to reprogram adaptive values for certain components after ...

Page 51: ...e current ignition cycle MIL SVS or Message Requested displays ECM requests to light the malfunction indicator lamp MIL or service vehicle soon SVS lamp or display a driver information alert Last Test Failed displays a complete list of failed tests Test Failed Since Code Cleared displays a list of tests that failed since the last time codes were cleared from ECM memory If SureTrack optional is act...

Page 52: ...o return to the Codes Menu Freeze Frame Failure Records This selection displays the DTC that was set along with corresponding data when the ECM commanded the malfunction indicator lamp MIL to turn on DTC Status This selection allows you to view the records of a particular DTC z To check DTC status 1 Select DTC Status from the Codes Menu The DTC Status entry field displays and the virtual keyboard ...

Page 53: ...ays if the engine was not cranked or started Data Screens When a Data selection is made the screen displays the data list for the selected module The items available for any electronic control module vary from one vehicle to another Data is presented in a 2 column format An abbreviated parameter name is at the left of each column and its value is at the right edge of the column Parameters display ...

Page 54: ...Sample data screen Data Graphs Select the Graph icon to open a data graph for that parameter Figure 4 25 Selecting a parameter for graph view moves it to the top of the list Select the Graph icon again to close the graph for that parameter and return to a data list view Figure 4 25 Sample graph view ...

Page 55: ...elect the Properties icon on the Scanner toolbar to open the dialog box 2 Highlight one of the Samples After Trigger options 3 Select the Accept icon to close the dialog box NOTE i You can also adjust the amount of data collected after a triggering event using the Properties icon on the Scanner toolbar See Properties on page 27 for additional information z To set triggers and record a snapshot 1 S...

Page 56: ...ialog box 7 Select Snapshot on the Data Buffer Toolbar to arm the snapshot The Snapshot icon changes color to indicate it has been armed Figure 4 27 Figure 4 27 Sample armed Snapshot icon Once all of the data is compiled data collection pauses and the information is saved as a movie A confirmation screen displays to let you know the name automatically assigned to the saved file and where to locate...

Page 57: ...Properties icon to open the dialog box for the graph you wish to scale 2 From the Graph Properties dialog box Figure 4 29 select Auto Scale On The check mark is cleared from the box and the minimum and maximum fields activate 3 Select either Max maximum or Min minimum to activate that field and open the keyboard 4 Type the desired scale value into the field 5 Select the other field and enter a val...

Page 58: ...uty cycle in 10 increments Reset Tests reset the adaptive or learned values that are stored in the electronic control module Selecting Functional Tests opens a menu of test options that varies by make and model Selecting a menu option either activates the test or opens a submenu of additional choices Follow all screen instructions while performing tests How and what information is presented on the...

Page 59: ...Sensor Monitoring displays on board oxygen sensor monitoring test results 06 On Board Monitored Systems displays the status of system monitors 08 Request Control of On Board System establishes bidirectional ECM communication 09 Calibration Identification displays the ECM calibration identification numbers 09 Calibration Verification Number displays the ECM calibration 09 In Use Performance Trackin...

Page 60: ...s detailed information on setting conditions testing and interpreting test results for specific codes Symptom Tips provides diagnostic tests and procedures based on vehicle operation Time Savers provides supplemental information such as firing order and 1 cylinder location that may be needed to make a diagnosis Common Problems provides advice and remedies for certain pattern failures that have bee...

Page 61: ...s A tip may also contain a hyperlink to a Troubleshooter Reference another test or procedure or a supplemental operation such as Clear Codes Hyperlinks are shown in blue and selecting them opens the link Troubleshooter References open in a separate window Figure 4 31 1 Live data values 2 Hyperlink Figure 4 31 Sample data values within a Troubleshooter tip ...

Page 62: ...turning off the tool z To exit Scanner and disconnect from a vehicle When disconnecting the Diagnostic Tool from the vehicle make sure the Scanner software is not communicating with the vehicle 1 From a codes or data display screen select the Exit icon on the upper toolbar Figure 4 32 Exit icon The screen goes to the codes or data menu 2 Select the Back icon on the upper toolbar Figure 4 33 Back i...

Page 63: ... and transmits vehicle data to the diagnostic tool The Scan Module operates on 12 or 24VDC vehicle power supplied through the vehicle s data link connector DLC 1 Data cable connector 2 Vehicle power LED green 3 Communication issue LED red 4 Bluetooth LED green 5 Memory card port remove protective hand grip for access 6 Universal serial bus USB jack remove protective hand grip for access Figure 5 1...

Page 64: ...ool 1 Turn on the diagnostic tool IMPORTANT The Scan Module needs to be powered on during the pairing process Connect the Scan Module to a vehicle or to the diagnostic tool using the USB cable Make sure the diagnostic tool has a charged battery or is connected to the AC DC power supply 2 Connect the 26 pin end of the data cable to the Scan Module data cable connector 3 Connect the 16 pin end of th...

Page 65: ...st A search in progress message displays during the pairing procedure Figure 5 3 the Paired Devices screen Figure 5 4 displays once the procedure completes Figure 5 3 Sample pairing in progress message 7 Select the Home icon on the Toolbar 8 Disconnect the data cable from the vehicle The Scan Module and diagnostic tool are now paired for wireless communication and should automatically recognize ea...

Page 66: ...liant vehicles Use the supplied DA 4 data cable with the optional DA 5 adapter and a manufacturer specific adapter The 26 pin end of the cable attaches to the data cable connector on the Scan Module The16 pin end connects to the DA 5 adapter the DA 5 adapter connects to the manufacturer specific adapter and then connects to the vehicle DLC The cable connectors are secured with captive screws While...

Page 67: ...ng idle particularly if the devices have been stationary 5 5 1 No Communication Message If the Scan Module is paired to the diagnostic tool and tries to communicate with the vehicle and the Scan Module is not connected to the vehicle a Connect Data Cable or no communication message displays A signal lost due to moving out of range automatically restores itself when the diagnostic tool is brought c...

Page 68: ... connection The red Communication LED flashes on and off when the Scan Module is performing an internal self test and is illuminated continuously if a failure is detected Figure 5 6 Hardware Icon Background Color Condition Action Red Not Paired Pair the Scan Module to the diagnostic tool See Pairing The Scan Module on page 56 for instructions Grey Paired but Not Communicating You may have moved ou...

Page 69: ...le On Solid the Scan Module is being powered by the vehicle but not communicating with the Diagnostic Tool Flashing the Scan Module is being powered by the vehicle and is communicating with the Diagnostic Tool Communication Off normal state no errors detected On Solid communications error detected Flashing internal self test in process will go out once the test completes Bluetooth Off there is no ...

Page 70: ...nnectivity 1 Disconnect the Scan Module from the vehicle 2 Navigate to the Home Screen on the diagnostic tool 3 Select Exit to close the ShopStream Diagnostic Suite 4 Connect the Scan Module to the vehicle 5 Select the ShopStream Diagnostic Suite icon on the desktop Figure 5 7 Sample ShopStream Diagnostic Suite desktop icon NOTE i The ShopStream Diagnostic Suite can also be started from the Window...

Page 71: ... on the diagnostic tool 2 Select Exit to close the ShopStream Diagnostic Suite 3 Wait for the Scan Module Communication LED to stop flashing 4 Select the ShopStream Diagnostic Suite icon on the desktop The ShopStream Diagnostic Suite should open with connectivity restored Windows Reboot Procedure This method which completely shuts down the diagnostic tool takes several minutes to complete z To reb...

Page 72: ...sition To avoid damaging the Scan Module never turn the ignition switch ON during the update process IMPORTANT To avoid damaging the diagnostic tool or scan module it is highly recommended to connect the AC DC power supply to the diagnostic tool before starting the firmware update process Damage can occur to the scan module if the diagnostic tool power is turned off or the power supply is disconne...

Page 73: ...Module Firmware Update Process USB cable If necessary this alternate firmware update procedure may be used to update the Scan Module firmware IMPORTANT The diagnostic tool must be connected and powered by the AC DC power supply during the Scan Module firmware update process Damage can occur to the Scan Module if the diagnostic tool power is turned off or the power supply is disconnected during the...

Page 74: ... small end of the USB cable into the USB jack on the Scan Module d Plug the large end of the USB cable into one of the USB jacks on the side of the diagnostic tool NOTE i When connected the scan module USB connection status icon background color will change from gray to green 1 Hinged cover 2 USB jack Figure 5 12 Scan Module USB jack 4 Select Scanner from the diagnostic tool Home screen 5 Select O...

Page 75: ...ware A successfully updated message displays once the installation process is complete Figure 5 14 Figure 5 14 Firmware update complete message 6 Select OK to close the message and return to the Scanner function The updated Scan Module is ready to use ...

Page 76: ...s related This mode is also used for testing OBD II EOBD compliant vehicles that are not included in the Scanner databases OBD Direct is a Scanner function and the Scan Module must be connected to the test vehicle and communicating with the diagnostic tool This function only provides generic OBD II EOBD information To access enhanced OBD II EOBD functions select Scanner from the Home screen Option...

Page 77: ...I Code Check This option displays any stored emission related generic DTCs reported by the ECM Selecting opens a submenu with two choices Codes Pending Codes Codes Codes displays a list of current emission related DTCs OBD II EOBD Codes have a priority according to their emission severity with higher priority codes overwriting lower priority codes The priority of the code determines the illuminati...

Page 78: ...lure after additional driving then a DTC is set to indicate a faulty component or system and the MIL is illuminated 6 1 2 Global OBD II Clear Codes This option is used to clear all emission related diagnostic data such as DTC records freeze frame data and test results from ECM memory Although OBD Direct only displays generic OBD II data clearing codes erases all of the stored data including any en...

Page 79: ...pens a menu with the following options Start Communication begins the test session Connector Information provides data link connector DLC location details for most models Manual Protocol Selection allows you to select which protocol to use 6 2 1 Start Communication Use the following procedure to conduct an OBD Direct test session z To perform an OBD Direct Test 1 Select Start Communications from t...

Page 80: ... many ECMs were detected which ECM is communicating and which communication protocol is being used displays Figure 6 5 Figure 6 5 Sample communication message 3 Select Continue and a menu of available tests displays Figure 6 6 Figure 6 6 Sample Start Communication menu 4 Select a test to continue ...

Page 81: ...osis process as it contains information on virtually all common diagnostic trouble code DTC problems and driveability symptoms for most vehicles covered by the vehicle communication software 01 Display Current Data Use this item to display the current emission related data from the selected electronic control module ECM of the vehicle Displayed data includes analog inputs and outputs digital input...

Page 82: ... vehicle Select a test and follow the on screen instructions 09 Read Vehicle Identification This selection displays the vehicle identification number VIN the calibration identification and the calibration verification number CVN of the test vehicle 09 In use Performance Tracking This selection displays the In use Performance Tracking of monitored data It is basically a record of the number of time...

Page 83: ...menu 6 2 3 Manual Protocol Selection A communication protocol is a standardized way of data communication between an ECM and a scan tool Global OBD may use several different communication protocols The scan tool automatically connects to an available protocol which displays on the connection message Figure 6 5 Some vehicles communicate on more than one protocol Use the Manual Protocol Selection op...

Page 84: ...omotive 12V systems do not use this product for Measurement Categories II III and IV Measurement Category I is for performing measurements on circuits not directly connected to MAINS or MAINS circuits an example of a MAINS circuit is 120V AC or 240V AC household or industrial electricity do not connect this product to MAINS or MAINS circuits Do not apply the Black Ground Lead to test points other ...

Page 85: ... file will look like Page Setup allows you to adjust margins and paper orientation Top Level Menus Selecting Top Level Menus opens a list of the following options Features Benefits How To Power User Tests Snap on Automotive Theory Features Benefits Selecting Features Benefits opens a menu page that includes 5 Minute Walk Thru With Demo Board explains how to use the optional demonstration board to ...

Page 86: ...est meter in the live graphing mode with O2S test tips to help you understand the fundamental concepts of O2S diagnostics Test Tips gives on screen instructions for performing specific Guided Component Tests along with drawings and tips 20 Minute Current Ramp Classes provides an introduction to current ramp testing Minute Current Ramp Classes provides an introduction to current ramp testing Theory...

Page 87: ...uently used A toolbar at the top of the screen allows you to custom configure the manufacturer list to display only the makes you frequently service Figure 7 1 Sample manufacturer list z To configure a favorites list 1 Select Configure Favorites on the toolbar A list of selectable manufacturers displays Figure 7 2 Sample Configure Favorites screen 2 Select each manufacturer you want to include sel...

Page 88: ...by selecting Configure Favorites from the toolbar 7 1 3 Identifying a Test Vehicle Exact procedures to identify the test vehicle may vary somewhat by vehicle and market The following procedure which identifies a 2008 Ford Focus for testing the fuel injection system is typical of what to expect z To identify a vehicle for Guided Component Test 1 Select the Guided Component Test Function icon from t...

Page 89: ... Figure 7 5 Sample available component tests list 9 Select a test to continue The identification sequence is now complete refer to the Operations section that follows for details on how to navigate through the Guided Component Test information and perform tests NOTE i If you return to the Home screen and select Scanner or Vehicle History the vehicle identification entered here is carried over Howe...

Page 90: ... and testing time 7 2 1 Component Information Component Information provides details on specific vehicle components to provide a better understanding of the components prior to diagnosis The Component Information screens contain information to assist you with testing The screens are divided in sections to help quickly guide you to the correct information Figure 7 6 Operation provides a general des...

Page 91: ...ow and where to connect the test meter leads and also automatically configures the multimeter or lab scope to perform the selected test Once a test vehicle is identified you can select a component from the available tests list z To select a test 1 Select a component from the list 2 Select TEST to open the list NOTE i More than one selection is available in some instances For example select Ignitio...

Page 92: ... additional information or open an additional window on top of the current screen Hyperlinks display as icons Common hyperlinks are View Meter opens a live meter set up to perform the test in the lower portion of the screen Figure 7 9 Once the meter view is open the Guided Component Test toolbar at the top of the screen is replaced by the Scope Multimeter toolbar which allows you to make adjustmen...

Page 93: ...h View Meter active Figure 7 9 select the Meter icon on the toolbar once and the meter expands to fill the entire screen 2 Select the Meter icon a second time and the meter open as a separate window Figure 7 10 This window can remain open if you switch to the Scan Module and can be accessed from the Windows toolbar at the bottom of the screen You can also resize and reposition the meter window on ...

Page 94: ...d Component Tests require the use of specific leads Information on specific leads and other connecting information displays on the initial test screen Follow the on screen connection instructions in the test procedure to connect the test leads Performing a Test Once you connect the test leads to the vehicle you can proceed with testing z To perform Guided Component Tests 1 Follow the instructions ...

Page 95: ...ured to transmit data to the VERDICT D7 Diagnostic Tool without a physical connection The M2 Scope Meter is powered by it s internal battery pack or can be powered using the supplied AC DC power supply 1 DC Power Supply Input Jack 2 Color Graphic Display Screen 3 Soft Keys for Selecting Additional Functions 4 Rotary Switch for Selecting Primary Functions 5 Common Ground Lead Input Jack 6 Channel 1...

Page 96: ...o sets of controls for the M2 Scope Meter 1 Soft Keys select test functions which vary depending upon the Rotary Switch position 2 Rotary Switch establishes the primary operation of the unit Figure 8 2 VERDICT M2 controls The following sections describe the external controls and features of the M2 Scope Meter ...

Page 97: ...ero to 1000 volts This setting is also used to measure frequency hertz duty cycle and time period cycle ms See Volts AC on page 95 Resistance Measures the DC resistance to current in Ohms in a range of zero to open circuit infinite See Resistance on page 97 Continuity Diode Check Performs dual tests circuit continuity and diode test forward drop The S special function soft key switches between the...

Page 98: ...l and relative reading Volts DC Volts AC Resistance Auxiliary F2 Freezes or pauses the data being displayed A second push returns the display to live data All except Continuity and Diode Check F3 Changes the measurement range when operating in the Volts DC Volts AC Resistance Auxiliary or capacitance range Changes the time base when operating in the graph mode Volts DC Volts AC Resistance Capacita...

Page 99: ...rent DC voltages within a range of zero to 1000 volts frequency duty cycle and pulse width Figure 8 3 Volts DC selected A typical Volts DC screen with Min Max active is shown in Figure 8 4 Note the functions of the F1 F2 and F3 soft keys are shown at the bottom of the display screen The F4 soft key is not operational in the Volts DC mode although the beeper does sound if the key is pressed Figure ...

Page 100: ... Display screen colors Figure 8 5 Sample active menu select mode screen Each of these operations are explained below a second long press of the F1 key returns the display to the normal mode The F4 key is nonfunctional in the alternate menu mode Pressing F1 from the alternate menu switches the internal beeper used for the continuity test and to indicate soft key pushes on and off The beeper functio...

Page 101: ...ntil the Min Max key is pressed again then A short press of the Min Max key resets the readings A long press of the Min Max key returns to normal Volts DC mode S Key Special Functions The S key is used to activate special time measurement functions available when sampling voltage Each press of the S key advances to the next function in the following order 1 The screen changes to show the frequency...

Page 102: ...mentally increases the measurement range The Range key incrementally decreases the measurement range F4 incrementally increases the timescale of the histogram The Graph key incrementally decreases the timescale A digital value of the signal displays in the upper right corner of the display while operating in graphing mode Graphing with Min Max Function In the Volts DC graphing function you can cap...

Page 103: ...press of the S key switches the display from duty cycle for pulse width There three items displayed on the LCD in the graph mode A histogram of the signal being measured displays across the screen The averaged result of the timing measurement appears on the upper right side of the screen The minimum and maximum value readings display on the upper left side of the screen after first pressing the Mi...

Page 104: ...l display mode Min Max Key Pressing the Min Max key causes minimum and maximum readings to display along with the current value A long press of the key returns to the normal display mode Range Key A press of the F3 or Range keys changes the voltage scale or resolution of the display Each key press incrementally advances through the available settings A long press of the Range key returns to displa...

Page 105: ...s between normal and relative readings A short push of the key resets the reading a long push opens the alternate menu F2 Key A single press of the F2 key pauses or freezes the displayed value A second press returns the display to normal mode F3 Key and Range Key A short push of the F3 or Range key changes the selected measurement range F4 Key and S Key The F4 and S Keys are nonfunctional in this ...

Page 106: ... test and diode test settings Continuity is the default setting When testing continuity the M2 Scope Meter sounds a beep if a short circuit is detected continuity between the two test leads When testing a diode the M2 Scope Meter induces a current to the device under test and measures the resultant voltage drop across the device 8 3 5 Auxiliary This selection allows you to select between three aux...

Page 107: ...ounds per square inch PSI and vacuum as inches of mercury inHg F4 Key The F4 key is nonfunctional in this mode S Key The S key is used to switch between the three different test modes amperage temperature and pressure available in the auxiliary setting Each key press advances to the next available mode Min Max Key Pressing the Min Max key causes minimum and maximum readings to display along with t...

Page 108: ... the F1 key does cause a beep to sound but the display remains unchanged A long push of the F1 key opens the alternate menu F2 Key A single press of the F2 key pauses or freezes the displayed value A second press returns the display to normal mode F3 Key and Range Key The F3 and Range keys select the measurement range F4 Key S Key Min Max Key and Graph Key The F4 S Min Max and Graph keys are nonfu...

Page 109: ...etting ranges for the F2 F3 and F4 keys Pressing the F1 key scrolls up through the list of settings and pressing the S key scrolls down through the list The F1 area on the screen shows which of the six settings is currently active Figure 8 14 Available scope functions are shown in the table below Setting F1 Key S Key F2 Key F3 Key F4 Key Display Scroll up Scroll down Freeze Scale Time Trigger Slop...

Page 110: ...on the screen The currently selected scale is shown at the top of the screen The Range key moves incrementally down through the list of available scales F4 and Graph each press of the F4 key advances to the next timebase or sweep rate which is the time represented on the width of the display The currently selected timebase is shown at the top of the screen Use the Graph key to move incrementally d...

Page 111: ...etween the rising positive edge and trailing negative edge of the waveform A graphic in the upper right corner of the display screen shows the currently selected slope F3 Level short presses of the F3 key incrementally increase the trigger voltage level An indicator to the right of the screen graph shows the current trigger voltage level Short presses of the Range key incrementally decrease the tr...

Page 112: ...ss F2 F3 or F4 to load the desired preset The selected preset loads and the meter is ready for testing The F2 F3 and F4 fields on the screen are acronyms for the type of test the preset is configured to perform Interpret as follows Preset A CGI S ground controlled injectors and solenoids LF AC low frequency alternating current signals HF AC high frequency alternating current signals Preset B PCI S...

Page 113: ...cts more data than what is needed to simply construct a waveform across the screen Therefore any signal glitches or fast events are captured Invert Pressing the F3 key inverts or switches the polarity of the signal trace so that it appears upsidedown on the screen This is typically used to sample amperage or high voltage signals Coupling Pressing the F4 key switches the input to the meter from DC ...

Page 114: ...up A long push of the F2 key places the trace at the midpoint of the scale Short pushes of the Min Max key moves the trace incrementally down A long push of the Min Max key places the trace at 10 of the scale Channel 2 Trace Use the F3 and Range keys to reposition the channel 2 trace as follows Short pushes of the F3 key moves the trace incrementally up A long push of the F3 key places the trace a...

Page 115: ... 1 on and channel 2 off 8 4 M2 Scope Meter Remote Operation The M2 Scope Meter can be used remotely wireless connection allowing you to operate your M2 Scope Meter using your Diagnostic Tool The M2 Scope Meter needs to be paired connected to the Diagnostic Tool for remote operation The following procedures describe the configuration and setup of the M2 Scope Meter for remote use with a Diagnostic ...

Page 116: ...ecommended that both devices be powered by their respective AC DC power supplies during the pairing operation The two devices to be paired should also be in close proximity to each other and in an area that is relatively free of radio frequency interference NOTE i The M2 Scope Meter can only be paired with one Diagnostic Tool at a time z To pair the M2 Scope Meter with the Diagnostic Tool 1 Turn o...

Page 117: ...te Functions setting 6 Select the System Settings icon on the Home screen of the Diagnostic Tool 7 Select Paired Devices from the menu 8 From the Paired Devices menu select Add from the toolbar 9 When prompted select OK from the toolbar The Diagnostic Tool searches for compatible wireless devices then displays the results The M2 Scope Meter is typically listed as VERDICT M2 plus six digits of the ...

Page 118: ...Figure 8 24 Figure 8 24 Typical Paired Devices screen 11 Select the Home icon on the toolbar to return to the Home screen M2 Scope Meter 12 After the M2 Scope Meter has been successfully paired turn the M2 Scope Meter Rotary Switch to the oscilloscope position 13 Press and hold the F1 key to open the alternate menu 14 Press the F4 key once to turn off disable Bluetooth Discovery mode The F4 field ...

Page 119: ...r can be remotely connected and operated at anytime using your Diagnostic Tool This allows you to use the M2 Scope Meter in stand alone mode and quickly switch to remote mode as needed The M2 Scope Meter transmits data wirelessly to your Diagnostic Tool allowing you to use your Diagnostic Tool display to view and control the M2 Scope Meter z To remotely operate the M2 Scope Meter with the Diagnost...

Page 120: ... on page 113 The M2 Scope Meter Diagnostic Tool Hardware Status indicators in the lower right corner of the Home screen also provide a quick reference to device status The background color of the status indicator icon represents the condition of the wireless connectivity Icon status is shown in the table below 4 Connect the M2 Scope Meter leads as needed For M2 Scope Meter operation see M2 Scope M...

Page 121: ...l will display a warning message when the signal is lost A red graphic image indicates that the devices are paired but not communicating Figure 8 27 If the two devices are out of range of each other the paired not communicating screen displays on the M2 Scope Meter and a message displays on the Diagnostic Tool This is a self correcting condition simply bring the two units closer together and the c...

Page 122: ...AC Use only appropriate Category III or IV Snap on components such as test leads scope leads and auxiliary components with meter and scope products Do not use aftermarket equivalents or alternate leads of unknown origin Use only Snap on suggested components that are in good working order Do not use components that show extreme wear or are visibly damaged Make sure the components are properly rated...

Page 123: ...tion Volts DC 40mV 0 01mV 1 0 of reading 3 digits 10M Ohm 400mV 0 1mV 4V 0 001V 40V 0 01V 400V 0 1V 1000V 1V 1 5 of reading 3 digits Volts AC 400mV 0 1mV 1 5 of reading 4 digits 10M Ohm 4V 0 001V 40V 0 01V 400V 0 1V 2 0 of reading 4 digits 1000V 1V Resistance 40 Ohm 0 01 Ohm 0 75 of reading 5 digits 600V DC or Peak AC 400 Ohm 0 1 Ohm 0 5 of reading 3 digits 4k Ohm 0 001k Ohm 40k Ohm 0 01k Ohm 400k...

Page 124: ...creens Frequency 40Hz 0 01Hz 0 5 of reading 2 digits N A 400Hz 0 1Hz 4kHz 0 001kHz 40kHz 0 01kHz 400kHz 0 1kHz 2MHz 0 001MHz Duty Cycle 0 1 99 9 0 1 N A N A Pulse Width 0 1 99 9 0 1 N A N A Diode Test 3V N A Range 2V N A Continuity 3V N A Threshold 0 1 N A Table 9 2 Scope Function Range Accuracy Comments Signal Measurement Ch 1 red banana jack Ch 2 green banana jack Each channel input is reference...

Page 125: ...round connection is needed The lead color matches the color of the GND socket on the Scope Multimeter Figure 9 3 Red Channel 4 lead Alligator Clips Three insulated alligator clips that attach to the test leads are included The insulator boots are colored to match each test lead Alligator clips attach to the probe end of the test lead z To install an alligator clip 1 Remove the collar from the prob...

Page 126: ...ional The optional Secondary Ignition Clip on Wire Adapter Figure 9 6 connects the Secondary Coil Adapter lead to the vehicle Secondary wire to display ignition patterns Figure 9 6 Secondary Ignition Clip on Wire Adapter Low Amp Current Probe optional The optional Low Amp Current Probe Figure 9 7 provides accurate and reliable non intrusive testing of ignition coils fuel injectors fuel pumps relay...

Page 127: ... current screen setup as a preset for quick access Save Single Frame saves a recording of the current screen Save All Frames saves a recording of the current screen plus all the data in the buffer Print opens a standard Windows Print dialog box for printing the current screen Setup This option allows you to adjust tool settings to your personal preferences Selecting opens a menu of the following U...

Page 128: ...ope multimeter screens typically include the following sections Figure 9 8 1 Scope Multimeter Toolbar allows you to configure the tool for the type of test and to adjust the settings for each channel or trace 2 Main Body displays test results Options on the toolbar let you select how tests display on the screen 3 Trace Details displays trace settings which can be adjusted or switched through the t...

Page 129: ...wn for each graduation on the scales When using the pressure transducers the pressure the transducer senses is converted into a voltage signal However the values are shown as pressure on the screen rather than voltage Similarly when using the optional Low Amp Current Probe the amperage sensed is converted to a voltage signal for processing but displayed as amperage on the screen Table 9 3 Scope Mu...

Page 130: ... cycle the Trace Details selection through three states Displayed trace settings are displayed in this mode Expanded trace settings are displayed in a larger format in this mode Off trace settings are not displayed in this mode Adjustments are made by selecting the item to be changed on the touch screen A dash indicates a function that is not selected and an icon displays to indicate an active fun...

Page 131: ...erage value of the waveform by blocking the DC portion of an input signal in order to amplify the AC portion This makes small variations in the trace visible Scale opens a dialog box that allows you to select the scale which is the total value displayed on the vertical axis of the display Sweep the current sweep setting is shown in white at the end of the scale list selecting opens a dialog box ad...

Page 132: ...apshot Arms the software to take a snapshot of the sampled data Step Back Moves to the previous point in the recorded data Back 1 Frame Moves to the previous frame in the recorded buffer Stop Stops recording data Record Begins recording data Play Recording Plays the data recording in a continuous loop at actual speed Forward 1 Frame Moves to the next frame in the recorded buffer Step Forward Moves...

Page 133: ...mediately however the dialog box must be closed to return to the main window and continue Make a selection to close the dialog box 9 3 Operations This section describes configuring the scope or meter and performing tests 9 3 1 Starting the Scope and Multimeter Use the following procedure to set up the scope multimeter for performing tests z To start the scope multimeter 1 Select the Scope Multimet...

Page 134: ...cuum 100 PSI Pressure 500 PSI Pressure 5000 PSI Pressure MT5030 Vacuum MT5030 Pressure EEDM506D Temperature Graphing Multimeter Options The following options are available for testing Single Graphing Meter Volts DC Frequency Pulse Width Duty Cycle Low Amps 20 Low Amps 40 Low Amps 60 100 PSI Vacuum 100 PSI Pressure 500 PSI Pressure 5000 PSI Pressure MT5030 Vacuum MT5030 Pressure EEDM506D Temperatur...

Page 135: ... measurement is out of range for the scale selected Arrows pointing UP measurement over maximum range Arrows pointing DOWN measurement under minimum range Voltage measurements also display arrows in place of live values when the voltage exceeds the input rating of the meter 51 1 Risk of electrical shock Do not exceed voltage limits between inputs as indicated on the rating label Use extreme cautio...

Page 136: ...also be made from the Trace Details area of the touch screen see Trace Details on page 122 Trace Details offers a shortcut to some of the operations described in the following sections z To adjust trace controls 1 Select Setup from the Scope Multimeter toolbar The Scope Multimeter Preferences dialog box opens 2 Double tap Traces to open the submenu 3 Select the tab for the trace to be configured f...

Page 137: ...ted A scale and the vertical position for the zero line of the trace that allows the whole waveform to fit on the screen is established when Auto Find is selected If Auto Find is selected on the trigger channel it also sets the trigger level halfway between the minimum and maximum value of the sampled signal to provide a stable waveform 10 The baseline position is the zero line of the trace use th...

Page 138: ...es the trigger Manual often called normal mode this option allows the user to set a triggering point and the trace does not begin to display until the signal reaches the trigger point None often called Histogram this is a no triggering mode that is automatically engaged whenever a timebase or sweep between 2 seconds and 20 seconds is selected Triggering is prevented at slower sweep rates to elimin...

Page 139: ...r to channel 2 None switches triggering off 2 Mode sets the method of triggering Auto automatic if a trigger is found the waveform displays If a trigger is not found after about a half second the waveform and a trigger not found message displays Manual if a trigger is found the waveform displays If a trigger is not found nothing displays no waveform and no message 3 Slope sets triggering to the ri...

Page 140: ... traces display and how they display on the screen Units use to adjust time and voltage interval settings Back use to return to the Preferences dialog box or select Exit to close the dialog box and return to the scope Display Settings Selecting Display from the View submenu opens the Display dialog box Figure 9 14 Figure 9 14 Sample Display dialog box NOTE i The tabs on the view setup dialog box a...

Page 141: ...igures the units to the full viewing area of the screen while Per Division adjusts the units to a single division one tenth of the screen Figure 9 15 Sample View Units dialog box A radio knob shows which setting is active on the Units dialog box select to change Figure 9 15 Setup Controls Basic tool settings are adjusted here z To adjust setup controls 1 Select Setup from the Scope Multimeter tool...

Page 142: ...tup Units dialog box Snapshot The Snapshot tab of the Setup dialog box opens a window that allows you to select how much data is captured after a snapshot is triggered Figure 9 17 Selections range from ten to ninety percent in increments of ten the current setting is highlighted Select a icon then select OK to close the dialog box Figure 9 17 Sample Snapshot dialog box Refer to Trigger Controls on...

Page 143: ...igital values and updates the viewing screen File Controls Selecting File from the toolbar opens a window with a menu of save options Save Configuration saves the current setup values as a preset Save Single Frame saves the data currently on the screen only Save All Frames saves the current screen plus all the data stored in the buffer Selecting a menu option opens the Save As dialog box and the v...

Page 144: ...one source Searching for repair information is easy as the search process is based on vehicle components so it matches the repair process Simply look up a component and ShopKey Pro returns only the relevant repair information including TSBs component location specifications operating values removal and installation procedures wiring diagrams and more Listed below are a few of the main features tha...

Page 145: ...l wrapped in an interactive community ShopKey Pro Vintage ShopKey Pro Vintage includes an extensive library of engine and chassis repair information along with wiring diagrams and other information for vehicles back to 1960 Contact your Snap on representative to learn more about ShopKey Pro or visit the following web pages Snap on Diagnostics ShopKeyPro Page ShopKeyPro com ShopKey Pro Training skt...

Page 146: ...y Toolbar 2 Main Body Records List Figure 11 1 Vehicle records list screen 11 1 1 Vehicle History Main Body Records List The main body of the screen lists all of the available vehicle records By default records are shown in the order in which they are entered However you can resort them by any of the categories shown as column headings You can also resize the individual columns z To sort records 1...

Page 147: ...ehicle record on the records list screen 2 Select Activate from the toolbar The Activate icon is removed from the toolbar once a vehicle has been selected 3 Select the Home icon The Home screen displays with the activated vehicle shown on the toolbar 4 Select any Function icon on the Home screen to begin testing Table 11 1 Toolbar icons Name Icon Description Back Returns to the previously viewed s...

Page 148: ...ehicle ID information is captured slightly different across the different functions e g Scanner Guided Component Tests etc as some functions may capture more less information during the process Selecting the Other Vehicle ID button opens a listing of the captured vehicle ID fields from each applicable function If more than one function was used to ID the vehicle you are given the option to use tha...

Page 149: ...or use the Select All or Deselect All options to remove all records Figure 11 3 Figure 11 3 Search and Show All Selecting Search opens a dialog box that allows you to search vehicle records by category You can search for data in the following categories Year Make Model Color Customer License State Technician z To search 1 Select Search from the toolbar 2 Enter the search criteria in the text field...

Page 150: ...s list screen with only the records found in the search criteria showing 4 Select Show All on the toolbar to restore the complete vehicle records list Settings Use Settings to determine which categories display on the vehicle records list screen Selecting the Settings icon opens a vehicle history category display menu z To change Settings 1 Select Settings to open the menu Figure 11 5 Sample Setti...

Page 151: ...ory Operations Screen Layout 2 Select or deselect the desired categories Highlighted items do not display Non highlighted items display 3 Select OK on the toolbar to accept the changes and return to the previous screen ...

Page 152: ...y of the saved file when available and the preview panel on the lower right displays an image if the selected file is a graphic 1 Data Manager Toolbar 2 Folders Panel 3 Preview Panel 4 Information Panel Figure 12 1 Sample Data Manager main screen The main screen includes folders for saved files from the various modules Camera Folder contains photographs taken with the built in camera See Image Vie...

Page 153: ...played in the folders panel up one level in the file structure Open Opens the highlighted folder or file New Creates a new folder Delete Moves the highlighted file or folder to the recycling bin Rename Opens a dialog box and the virtual keyboard for renaming the selected file or folder Save The Save function is not implemented at this time Properties Opens a dialog box and the virtual keyboard for...

Page 154: ...olbar 12 3 2 Up This icon reflects the items shown in the folders panel of the screen up in the file structure one level at a time For example one tap of the Up icon when viewing the contents of the Scanner Data Folder returns you to the main screen A second tap would display the contents of the My Documents folder 12 3 3 Open The Open icon is only active displays in color when an item in the fold...

Page 155: ... return to the previous page 12 3 4 New The New icon allows you to create a new folder This option is only available when the icon displays in color z To create a new folder 1 Select the New icon on the toolbar The New Folder Name dialog box opens Figure 12 3 2 Select the entry field on the dialog box to open the virtual keyboard 3 Type a name for the new folder using the virtual keyboard 4 Select...

Page 156: ...s to delete the file or Cancel to exit z To delete an item 1 Select to highlight the item or folder to be deleted 2 Select the Delete icon on the toolbar A confirmation message displays Figure 12 4 Figure 12 4 Sample delete confirmation message 3 Select OK to delete the selected item and return to the previous page The Cancel icon returns you to the previous page without deleting the selected item...

Page 157: ...Select the Rename icon on the toolbar The New Name dialog box opens Figure 12 3 Figure 12 5 Sample new name dialog box 3 Select the entry field on the dialog box to open the virtual keyboard 4 Type the new name into the entry field using the virtual keyboard 5 Select the OK icon to change the name and return to the previous page The Cancel icon returns you to the previous page without changing the...

Page 158: ...igure 12 3 Figure 12 6 Sample Properties dialog box without the virtual keyboard 3 Type a new name into the field using the virtual keyboard if you want to rename the file 4 Use either the virtual keyboard or the dropdown menus to fill in the Year Make Component and Condition fields 5 Select the OK icon to change the name and return to the previous page The Cancel icon returns you to the previous ...

Page 159: ...NOTE i This diagnostic tool is equipped with Microsoft Outlook Express e mail client To use this client open the Microsoft Outlook Express program and run the New Connection Wizard following the screen prompts and then either create an e mail account or use your existing account to complete the setup You may be required to enter setup information e g incoming and outgoing server names types and po...

Page 160: ... 5 Select the Send icon to send the e mail NOTE i You must have an Internet connection to send e mail z E mail client installation and setup Example The following instructions are intended as a guide only as e mail client setup procedures vary 1 Download an email client e g Mozilla Thunderbird Figure 12 9 Figure 12 9 attachment ...

Page 161: ...ager Operations Operations 2 Install the software following the screen prompts Figure 12 10 Figure 12 10 3 Continue through the setup If available choose set as my default mail application Figure 12 11 Figure 12 11 ...

Page 162: ...t Figure 12 12 Figure 12 12 5 Enter your e mail information as required Figure 12 13 NOTE i E mail client configuration settings should automatically be set during installation If problems arise with the setup and manual configuration is needed refer to the e mail client help information and the Windows help information Figure 12 13 ...

Page 163: ...sword to allow the client to continue the setup with your provider Figure 12 14 Figure 12 14 7 Follow the screen prompts to allow the client to link to your email address 8 Once the client has successfully linked to your address you can begin using the new e mail client software on the diagnostic tool Figure 12 15 Figure 12 15 ...

Page 164: ...page 156 for additional information 12 4 1 ShopStream Connect Data files saved on your diagnostic tool are designed and intended to be reviewed using the Data Manager functions as described earlier An alternative method can be used to review select data files on a PC using ShopStream Connect ShopStream Connect is PC based program that allows you to manage view and print data files using a PC ShopS...

Page 165: ...ved Scanner data files select the Scanner Data Folder menu option from the Data Manager main menu Scanner DataViewer Opens pids scm scs scp and spm file extensions 1 Menu bar 2 Display toolbar 3 Graph display 4 Properties icon 5 Vertical Scroll bar 6 Zoom controls 7 Slider bar 8 Navigation toolbar 9 Parameter text list 10 Parameter configuration tabs Figure 12 17 Scanner Data Viewer ...

Page 166: ...ngs include print as graphs or text which pids to include number of pids per page display colors and the text font Figure 12 18 Figure 12 18 Pids print settings z To print 1 Select the desired pids A checked box indicates the pid will be printed Select again to deselect the pid 2 Select Change to modify the font this opens a standard Windows font dialog box a Modify the font as desired b Select OK...

Page 167: ... displayed on the screen Figure 12 20 Figure 12 20 Scanner DataViewer View menu Select from the following menu options Text Only shows all parameters and their values as text only Graphs Only shows all parameters as graphs only Text and Graphs shows all parameters and their values as text in the left panel of the screen and shows them as graphs in the right panel of the screen ...

Page 168: ...to open a color palate Sweep use to adjust the number of data frames that appear on the screen zoom in or out highlight and type in the desired number Reset Colors use to restore the default color settings Data Item use this pulldown menu to select individual graphs for modification Auto Scale minimum and maximum Y axis values automatically adjust to the signal when the box is checked uncheck the ...

Page 169: ...provides the following controls Figure 12 22 Exit closes Scanner DataViewer Hide PID List toggles display between parameter text and graph views Display Views 1 to 16 determines how many graphs display at a time Scale switches the scale values shown to the left of the graph off and on Sweep switches the sweep values shown below the graph off and on Figure 12 22 Display toolbar ...

Page 170: ... multiple steps 2 Step Back Allows backward movement in singular steps 3 Play Select to play 4 Step Forward Allows forward movement in singular steps 5 Skip Forward Allows forward movement in multiple steps 6 Pause Select to pause playback Figure 12 23 Playback controls Zoom Controls The zoom controls allow you to incrementally increase or decrease the screen magnification Figure 12 24 Figure 12 2...

Page 171: ...During playback the number displayed on the left side of the slider bar indicates the current position of the cursor in the data file The cursor can be repositioned during playback or when paused by selecting and dragging Use the scroll bar right side to vertically scroll through the parameter list and graphs 1 Cursor 2 Scroll bar 3 Slider bar Figure 12 25 ...

Page 172: ...ized by selecting and dragging parameters from the text list or graph display to a different location in the text list or in the graph display Figure 12 26 The highlighted parameters in the text list indicate which parameters are displayed as graphs NOTE i The parameter text list is sortable by name and value Select Name or Value at the top of the list to change the sorted view Figure 12 26 ...

Page 173: ...meter configuration tabs allow you to choose between displaying all available parameters Complete List or only those from a Custom List Figure 12 27 z To customize the parameter list 1 Select the Custom List tab Figure 12 27 2 Select Edit List in the custom window 1 Edit List 2 Custom List tab Figure 12 27 ...

Page 174: ...re 12 28 3 Select the parameters to include in your custom list Select All and Deselect All controls are also available to assist in the selection process Figure 12 28 Creating a custom parameter list 4 Select Save Exit to close the window Only the parameters selected in your custom list are displayed ...

Page 175: ...scope file is selected it opens and displays in the Scope File Viewer The Scope File Viewer is intended to be used to review scope and meter files originally captured on a diagnostic tool Some features control icons of the Scope File Viewer may not be available grayed out This is normal as those features are only applicable when viewing live data on a diagnostic tool The Scope File Viewer screen i...

Page 176: ...er Operations Image Viewer 12 8 Image Viewer The Image Viewer allows you to open and view image files and screenshots Figure 12 30 1 Exit closes the Image Viewer 2 Print prints the image 3 Captured Screen Image 3 1 2 ...

Page 177: ...p of the screen is used to adjust screen magnification and to exit Help Table 13 1 Help toolbar icons Name Icon Description Back Closes the help file and returns you to the previously viewed screen Zoom Incrementally increases the screen magnification Zoom Incrementally decreases the screen magnification Reset Restores the default screen magnification Previous Page Moves back one page in the docum...

Page 178: ...ore 14 1 Paired Devices Wireless devices communicate with the Diagnostic Tool to allow you work and access data remotely while working on a vehicle Wireless devices such as the Scan Module and M2 Scope Meter need to be paired or synchronized the first time they are used together z To check the devices paired to your Diagnostic Tool 1 Select System Settings Paired Devices The paired devices screen ...

Page 179: ... Grey Paired but Not Communicating You may have moved out of range Move the Diagnostic Tool closer to the Scan Module to reestablish communications If connectivity is not restored perform the Recovery Procedure on page 62 Blue Paired and Communicating Hardware status is good and Bluetooth should be functional Verify that the green Bluetooth LED on the front of the Scan Module is flashing If there ...

Page 180: ...tem Settings menu select Shop Information The Shop Information dialog box opens Figure 14 2 Figure 14 2 Sample Shop Information dialog box 3 Select within any of the information fields and the virtual keyboard opens 4 Use the virtual keyboard to fill in the Shop Information form As an alternative you can connect a USB keyboard to a USB jack on the Diagnostic Tool and use it to enter information in...

Page 181: ...lose the virtual keyboard and review the information once all the fields have been filled in 6 Select OK from the toolbar to save the Shop Information or Cancel to close the Shop Information dialog box without saving The Shop Information screen closes and the screen returns to the System Settings menu ...

Page 182: ...saved data The following types of data are backed up ShopStream Data saved movie data files Lab Scope Settings presets Vehicle History Records and Favorites z To Backup Information 1 From the Home screen select System Settings 2 From the System Settings main menu select Data Backup Backup The destination drive dialog box opens Figure 14 4 3 Select a drive destination NOTE i Drive designations e g ...

Page 183: ...information z To perform a data Restore 1 From the Home screen select System Settings 2 From the System Settings main menu select Data Backup Restore The restore file confirmation dialog box opens Figure 14 5 3 Select Continue Figure 14 5 The Windows restore backup file path dialog box opens 4 Select the backup file file extension sna from your backup file location 5 Select Open to restore the bac...

Page 184: ...ersion installed on the diagnostic tool and a Wi Fi Internet connection to use SureTrack SureTrack information is accessible in two ways From within the Scanner Function The SureTrack CRP graph along with Real Fixes and Tips are provided when viewing codes from within the Scanner function see Using SureTrack in the Scanner Function on page 177 From the SureTrack Community within ShopKey Pro The Su...

Page 185: ...and a Fix It icon Figure 15 1 Selecting the Fix It icon displays the following SureTrack menu options Common Replaced Parts Graph Dashboard Feature Information 15 2 1 Common Replaced Parts Graph The Common Replaced Parts graph Figure 15 1 shows the percentage of verified fixes using the parts listed derived from the total number of repairs by mileage The example below indicates that based on 41 re...

Page 186: ...ion about the current DTC describing code setting conditions possible symptoms system operation and possible solutions Figure 15 2 In addition other reference links may be provided such as schematics and illustrations Figure 15 2 Fix It DTC Information Menu options are also provided for the following Related Tips opens a list of tips that may include information that is related to the current DTC ...

Page 187: ...may be caused by a Wi Fi connection issue or if you do not have the current software upgrade installed Loading content from SureTrack indicates SureTrack information is being updated from the SureTrack database A new diagnostic software upgrade is available See your sales representative for details indicates your access to SureTrack will be expiring soon and you should contact your sales represent...

Page 188: ...oftware version installed on the diagnostic tool Create a SureTrack Account see Creating a SureTrack Account on page 180 Have a current SureTrack Authorization Code see Finding your SureTrack Authorization Code on page 182 Have a Wi Fi Internet connection Have the current Firefox web browser installed on the desktop Creating a SureTrack Account In order to use the SureTrack Community you will need...

Page 189: ...ro Figure 15 6 4 5 6 7 X 8 9 Choose 3 security questions 10 Find the SureTrack Authorization Code on your sales receipt 12 digit alpha numeric code e g 123ABCAP4 US 2 3 Enter all required information See Finding your SureTrack Authorization Code on the next page ...

Page 190: ...3ABCAP4 US Figure 15 8 NOTE i If you are currently in the Software Subscription program you will receive your SureTrack authorization code by mail upon the new software upgrade release Subscription software upgrades are installed using the Subscription Upgrade Manager program installed on your diagnostic tool 11 13 Enter the SureTrack Authorization Code Enter all required information scroll down 1...

Page 191: ...e these instructions after you have created your SureTrack account See Creating a SureTrack Account on page 180 z To log in to your active existing account 1 Navigate to the login page on shopkeypro com by Selecting the Repair Information icon from the Home screen If required enter vehicle identification information as prompted any vehicle can be used if a vehicle is not active Or Visit shopkeypro...

Page 192: ...al login screen 3 On the renewal login screen enter the NEW SureTrack authorization code found on your software upgrade sales receipt See Finding your SureTrack Authorization Code on page 182 for additional information 4 Follow the screen prompts to complete the login 15 4 About Upgrade Reminder Messages As a reminder to keep your software current and retain your access to SureTrack software upgra...

Page 193: ...hen connected to the Internet the SST automatically checks for new software updates This automatic check also occurs every time the diagnostic tool is turned on If a software update is available the SST will download it The SST is a low priority program that only downloads software updates when unused bandwidth is available If other programs are running that communicate over the Wi Fi network such...

Page 194: ...ows you to check the status of an active download Settings provides SST program options Turn on off automatic software installation Applies only for SST program updates The default setting is on box checked Set the hourly interval for the SST to check for software updates choose number 2 to 168 Applies to SST program updates and diagnostic tool software upgrades updates The default interval is 4 h...

Page 195: ...ly using the diagnostic tool Download times will vary as they are dependent on the file size of the upgrade some upgrades may exceed 3Gb and your connection speed It is suggested that you start the download at the end of your day and let it run overnight It is also suggested that you ensure a download of this size is within the available data allowance of the Internet connection or data plan being...

Page 196: ...lable message displays Select the message to close it If updates are found they will automatically begin to download Figure 16 5 Figure 16 5 Typical Downloading update window NOTE i The percentage status bar may not always be displayed while downloading Figure 16 5 3 During an active download two options are available Minimize closes the message box The download continues as a background task and ...

Page 197: ...ion is interrupted during a download the download is suspended and a network unavailable message displays The message disappears and the download resumes automatically once the Internet connection is restored 16 3 Installing Software Updates When a software update is ready for installation an installation update message will appear Figure 16 6 You can select the message or the SST icon from the sy...

Page 198: ...e ShopStream Diagnostic Suite should remain closed until the software installation has completed 4 Follow the on screen instructions to complete the installation 5 After the installation is complete open the ShopStream Diagnostic Suite application 6 If applicable select Scanner from the Home Screen If a Scan Module firmware update has been received a Scan Module firmware update message will displa...

Page 199: ...tact information at the front of this manual NOTE i If applicable before installing a software upgrade have your Scan Module and USB cable available The software upgrade may include firmware updates that need to be installed to the Scan Module z To install a software upgrade 1 Select the software upgrade available message Figure 16 8 or the SST icon from the system tray Figure 16 8 Typical upgrade...

Page 200: ...eam Diagnostic Suite should remain closed until the software installation has completed 4 Follow the on screen instructions to complete the installation 5 After the installation is complete open the ShopStream Diagnostic Suite application 6 If applicable select Scanner from the Home Screen if a Scan Module firmware update has been received a Scan Module firmware update message will display proceed...

Page 201: ...aner IMPORTANT Do not use any abrasive cleansers or automotive chemicals on the touch screen 17 1 2 Calibrating the Touch Screen The touch screen can be calibrated for accuracy using the PenMount PM utility of the Diagnostic Tool z To calibrate the touch screen 1 From the Windows toolbar select Start PenMount Control Panel Figure 17 1 Starting the calibration program 2 In the PM Control Panel high...

Page 202: ...ibrate the screen Advanced uses 9 16 or 25 points on the screen to accurately bring the unit into calibration Use the dropdown menu to select the number of points a stylus is required to calibrate the screen 4 Select and hold the center of each red box that displays in sequence Figure 17 3 Sample calibration target 5 Select OK to close the dialog boxes once the calibration is complete ...

Page 203: ...l installed in docking cradle 1 From the Windows toolbar select Start Control Panel Display The Display Properties dialog box opens 2 From the dialog box select Settings Advanced The Default Monitor and Intel Driver dialog box opens 3 From the dialog box select the Display Config tab 4 From the Display Config tab select LVDS clone CRT from the Display Configuration dropdown menu Figure 17 4 Figure...

Page 204: ...ns icon Figure 17 5 Figure 17 5 Sample Multiple Monitors tab 5 Follow the screen prompts and touch the screen of the Diagnostic Tool as requested 6 Type S on the USB keyboard to skip for extended display as requested 7 Select OK from the Multiple Monitors tab to close the PenMount Control Panel dialog box 8 Calibrate the touch screen using the standard procedure 17 1 3 Cleaning and Inspecting the ...

Page 205: ...o user serviceable components Tampering with the battery pack terminals or housing will void the product warranty Keep the following in mind when using and handling the VERDICT battery pack Do not short circuit battery pack terminals Do not immerse the VERDICT Diagnostic Tool or battery pack in water or allow water to enter the Diagnostic Tool or battery pack Do not crush disassemble or tamper wit...

Page 206: ...resentative to order a new one IMPORTANT Replace the battery pack with original Snap on replacement parts only z To replace the battery pack 1 Loosen the two captive screws that secure the battery pack to the back of the Diagnostic Tool 2 Insert a fingernail into the recess at the mid point of the top of the battery pack then gently raise the battery pack up to release the electrical connector 1 C...

Page 207: ...o local regulations Contact your sales representative for details Battery Pack Calibration The internal battery pack contains a micro controller that monitors the battery pack characteristics and maintains an internal fuel gauge The internal fuel gauge may lose some accuracy after many cycles of partial discharge and charge Should this happen the fuel gauge can be calibrated with the following pro...

Page 208: ... program loads 3 Select OK from the confirmation message A progress indicator displays while the files are being restored 4 Select OK from the confirmation message The Diagnostic Tool shuts down then reboots and the system recovery portion of the operation begins Follow any on screen prompts The Diagnostic Tool shuts down and reboots a second time When the VERDICT Home screen displays the procedur...

Page 209: ...abs on the handgrip fit into the grooves on the housing 17 3 M2 Scope Meter This section covers how to care for your M2 Scope Meter 17 3 1 M2 Scope Meter Cleaning and Inspecting the M2 Scope Meter When using the M2 Scope Meter make sure to do the following Check the housing wiring and connectors for dirt and damage before and after each use At the end of each work day wipe the housing wiring and c...

Page 210: ...battery terminals Electric shock can cause injury IMPORTANT Be aware of all applicable safety considerations when replacing handling and recycling batteries Refer to Battery Safety Guidelines on page 197 for details z To replace the battery pack 1 Refer to Figure 17 8 1 Hanger Catch 2 Captive Screw Figure 17 8 M2 Scope Meter battery pack replacement 2 Press to release the hanger catch on the back ...

Page 211: ...e battery pack electrical connector 7 Connect the new battery pack electrical connector to the M2 Scope Meter 8 Fit the battery into the battery compartment 9 Fit the battery compartment cover 10 Tighten the captive screw and fold down the hanger ...

Page 212: ...o a vehicle 36 86 Connector Information 75 Current probe 118 D Data display 42 45 Data Manager 144 operations 146 150 151 properties 150 screen layout 144 toolbar 145 data parameters displaying 42 43 delete 140 demonstration programs 22 diagnostic connector 75 location 75 diagnostic trouble codes DTCs 42 Display Device battery replacement 197 cleaning 196 connecting wireless devices 110 170 contro...

Page 213: ...dures 2 Properties 27 R readiness monitors 70 Recording data 124 Repair Information 136 reset tests 50 S Safety iii Scale 30 Scan Module introduction 7 specifications 8 10 Troubleshooter 73 wireless communication 7 36 Scanner actuator tests 42 alarms 26 checking codes 69 cleaning 200 clear codes 42 70 codes menu 42 43 45 communication protocol 75 component tests 50 custom data list 25 26 data 45 4...

Page 214: ...170 172 system tests 42 50 T terminology 1 Test leads 116 117 tests actuator 42 component 50 functional 42 50 Power User 77 selecting 36 subsystem 50 system 42 50 tips 78 toggle tests 50 Toolbar 16 record playback controls 124 scope multimeter 121 Vehicle History 139 toolbar Scanner 25 Trace controls scope 128 trigger condition 48 Triggers setting 47 trouble codes See diagnostic trouble codes DTCs...

Reviews: