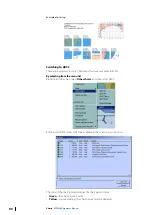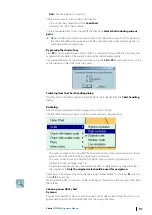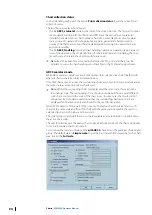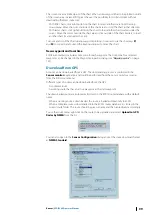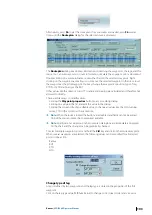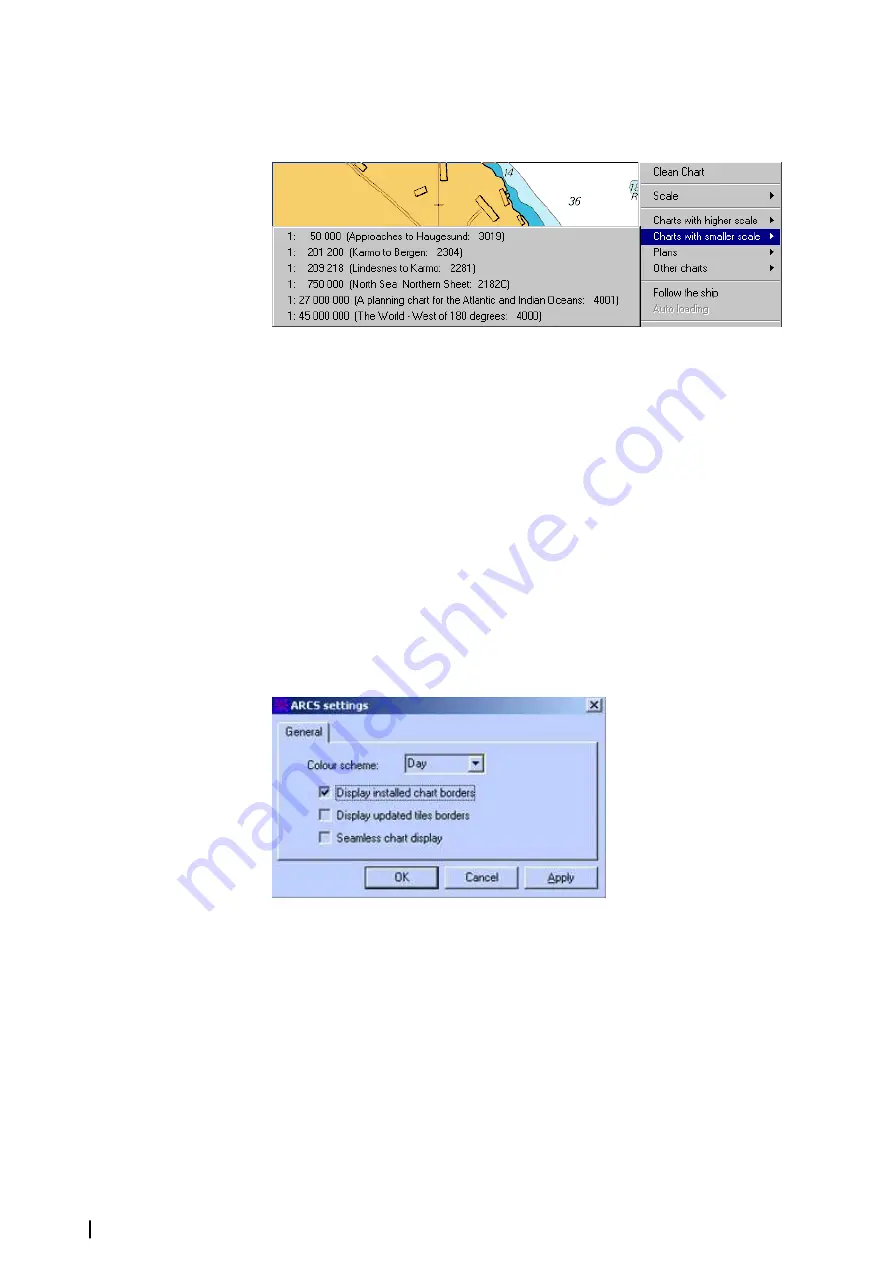
Locate the cursor on either Charts with higher scale or Charts with lower scale to display the
list of available charts.
ECDIS scans the chart catalogue to find all available charts containing the point where the
cursor was located and displays these charts.
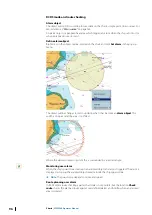
To move to a plan, click Plans and a menu of available plans relating to the current chart will
appear. Select a plan and the system displays it.
By dialog
To load any other ARCS chart, not containing the point clicked on, locate the cursor
anywhere on the chart, click right, locate the cursor on Other Charts, select ARCS and toggle
off the check box Select chart including current point as described in the previous paragraph.
By mouse
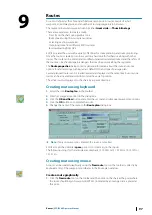
In chart-by-chart mode, locate the cursor outside the chart and double click. ECDIS scans the
catalogue to find all available charts containing the point where the cursor was located. The
best scale chart is loaded and displayed.
In seamless mode double click on the inactive chart to make it active.
By hot keys or buttons
Press
+
or
-
to load the chart containing the center of the screen with higher or lower scale.
Alternatively, right click on the zoom in zoom out buttons to achieve the same.
Chart settings
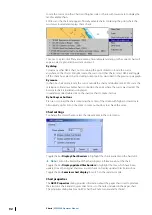
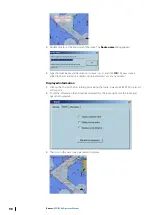
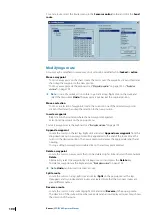
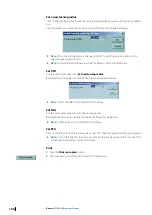
To change the color scheme, select the relevant item in the color menu.
Toggle the box
Display Chart Borders
to highlight the charts available on the hard disk.
Ú
Note:
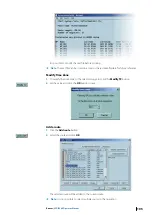
Click on the borderline of the chart displays information about the chart.
Toggle the box
Display updated tiles borders
to highlight the tiles, which have been
updated since the original chart was issued, check on Display updated tiles borders box.
Toggle the box
Seamless chart display
to switch on the seamless mode.
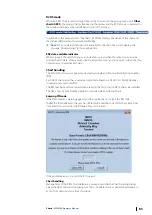
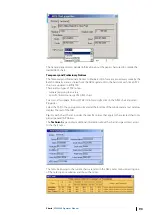
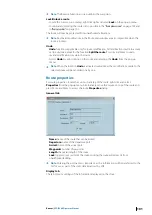
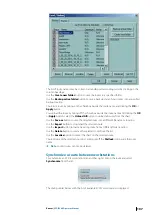
Chart properties
The
ARCS Properties
dialog provides information about the paper chart used to produce
the electronic chart and also gives direct access to the notes included in the paper chart.
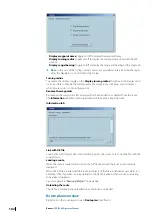
The properties dialog box for an ARCS chart has 2 tabs: General and Technical.
92
Charts
| ECDIS900 Operator Manual


