Display views
•
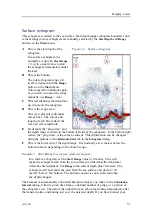
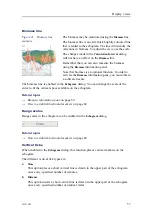
Lower Echogram
: This histogram is created based on fish echoes from the bottom
echogram for the chosen channel. By default, this is a bottom echogram.
The data is calculated based on the selection you have made in the
Calculation
Interval
dialog.
If you have selected only a small vertical range close to bottom, the histogram
may be empty. This because the fish volume is small due to the limited range
selected, and because the target strength algorithm must take into consideration
other bottom echoes than fish.
•
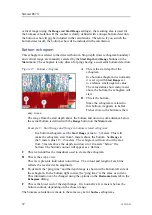
Zoom
: This histogram is created based on fish echoes from the currently zoomed
area.
3
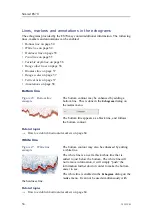
Mean value
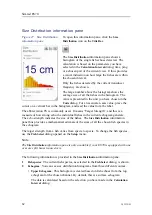
: The large number above each histogram is the mean value from the
tallest bar. The unit reflects the mode chosen in the
Size Distribution
dialog.
To change the settings in the histogram, click
Size Distribution
on the
Active
menu.
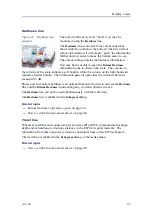
The
Size Distribution
dialog allows you to shape the
histogram in the
Size Distribution
information panel to
your own requirements. You can set up the mode, the
upper and lower limits, the accuracy, and the vertical resolution.
Related topics
•
How to monitor the fish size distribution
on page 93
343539/B
63
Summary of Contents for ES70 - DOWNLOAD AND INSTALLATION REV B
Page 2: ......
Page 128: ...ISBN 13 978 82 8066 118 0 2010 Kongsberg Maritime AS ...


