Display views
Display organisation
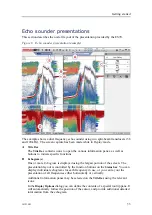
Figure 10
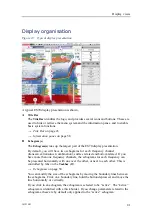
Typical display presentation
A typical ES70 display presentation is shown.
A
Title Bar
The
Title Bar
identifies the logo, and provides several icons and buttons. These are
used to hide or retrieve the menu system and the information panes, and to enable
basic system functions.
→
on page 43
→
on page 58
B
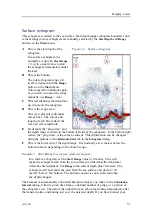
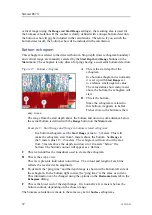
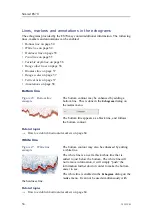
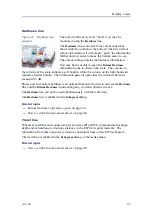
Echogram(s)
The
Echogram(s)
take up the largest part of the ES70 display presentation.
By default, you will have two echograms for each frequency channel
(transceiver/transducer combination); surface related and bottom related. If you
have more than one frequency channels, the echograms for each frequency can
be presented horizontally with one over the other, or next to each other. This is
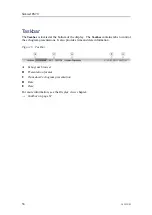
controlled by tabs on the
Taskbar
(D).
→
on page 50
You can modify the size of the echograms by moving the boundary lines between
the echograms. Click on a boundary line, hold the button depressed, and move the
line horizontally or vertically.
If you click in an echogram, the echogram is selected to be “active”. The “active”
echogram is identified with a thick border. If you change parameters related to the
echograms, these are by default only applied to the “active” echogram.
343539/B
41
Summary of Contents for ES70 - DOWNLOAD AND INSTALLATION REV B
Page 2: ......
Page 128: ...ISBN 13 978 82 8066 118 0 2010 Kongsberg Maritime AS ...

