SCALANCE W User Interface
6.2 Main Window
SCALANCE W1750D UI
66
Configuration Manual, 02/2018, C79000-G8976-C451-02
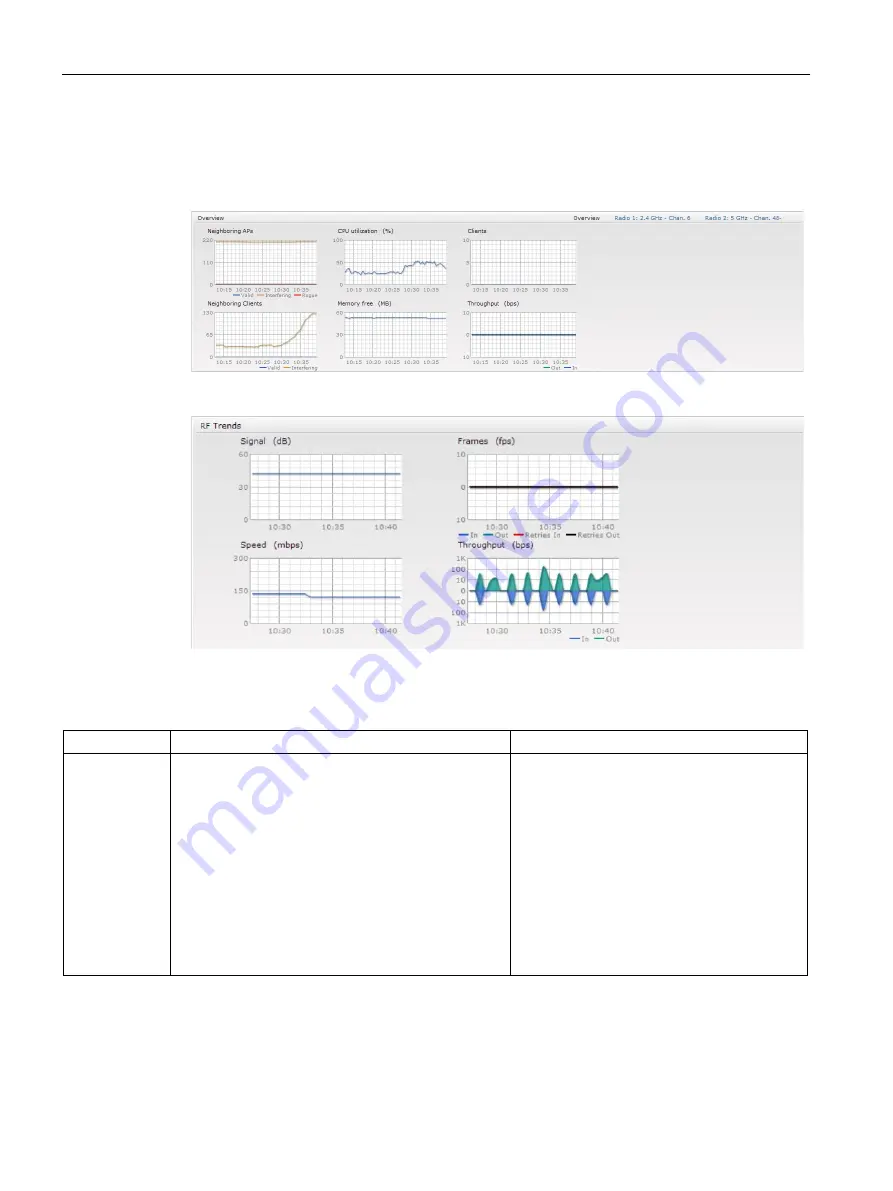
RF Trends
The RF Trends section displays the following graphs for the selected AP and the client. To
view the details on the graphs, click the graphs and hover the mouse on a data point:
Figure 6-10
RF Trends for Access Point
Figure 6-11
RF Trends for Clients
The following table describes the RF trends graphs available in the Client view:
Graph Name
Description
Monitoring Procedure
Signal
The Signal graph shows the signal strength of the
client for the last 15 minutes. It is measured in deci-
bels.
To see an enlarged view, click the graph. The enlarged
view provides Last, Minimum, Maximum, and Average
signal statistics of the client for the last 15 minutes.
To see the exact signal strength at a particular time,
move the cursor over the graph line.
To monitor the signal strength of the selected
client for the last 15 minutes:
1.
Log in to the SCALANCE W UI. The Virtual
Controller view is displayed. This is the
default view.
2.
On the Clients tab, click the IP address of
the client for which you want to monitor the
signal strength.
3.
Study the Signal graph in the RF Trends
pane. For example, the graph shows that
signal strength for the client is 54.0 dB at
12:23 hours.


