5
SETTING OF FUNCTIONS
61
SETTING OF FUNCTIONS
Chapter
5
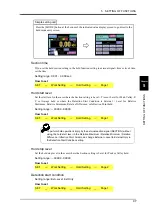
Detection section display
By plotting a graph at the same time as the hold function, a cobalt line indicating the detection
section is displayed at the bottom of the X-axis.
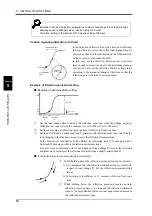
Hold Start Level display
If the Hold Start Level is used in the hold function, a light blue line is displayed. Also, a dotted line
appears when the Hold Start Level is outside the graph area.
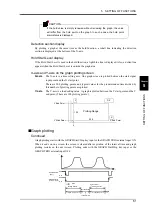
X-axis and Y-axis on the graph plotting screen
X-axis
The X-axis is a time setting axis. One graph screen is plotted between the start signal
input point and the X start point.
There are 200 plotting points, and typical values for the predetermined time divided by
this number of plotting points are plotted.
Y-axis
The Y-axis is a load setting value. A graph is plotted between the Y start point and the Y
end point. (There are 100 plotting points.)
■
Graph plotting
Continued
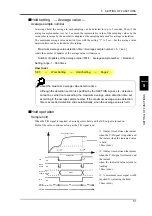
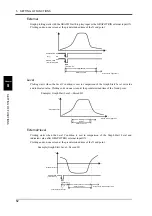
Graph plotting starts with the GRAPH Start/Stop key input or the GRAPH TRIG external input ON.
When it ends on one screen, the screen is cleared after expiration of the interval time and graph
plotting restarts on the next screen. Plotting ends with the GRAPH Start/Stop key input or the
GRAPH TRIG external input OFF.
CAUTION
If the hold value is simply renewed without renewing the graph, the value
will differ from the hold point on the graph. In such a case, the hold point
alarm status is displayed.
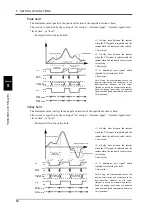
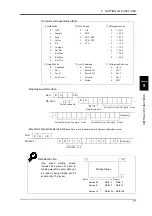
Plotting Range
D Z
100
Y
X
200
X End Point
Y End Point
Y Start Point
0
t
+
GRAPH TRIG
Start
Plotting Section
(Screen Hold)
Plotting Section
X(TM) end point
X(TM) end point
Screen Clear
Interval Time
(external input)
OFF
ON
OFF
ON
START/STOP
(Key)
Summary of Contents for DS-6200
Page 1: ......
Page 11: ...CONTENTS 10 M E M O...
Page 12: ...11 11 STANDARD...
Page 13: ...12 12 M E M O...
Page 92: ...91 91 EXPANSION...
Page 93: ...92 92 M E M O...
Page 95: ...Expansion Function 94 M E M O...

