Operating Instructions – MOVITRANS® THM20C / THM20E Pick-Ups
33
6
Technical data of THM20E
Technical Data
6.2.3
THM20E transmittable mean power
Notes on pick-up
characteristic
curves
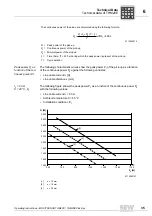
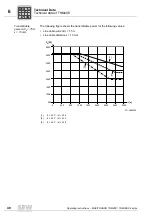
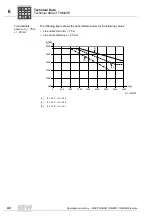
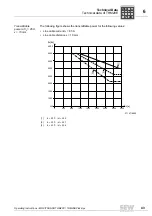
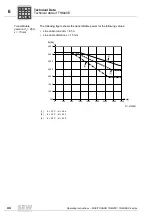
During project planning, you have to determine the continuous power P
2
(= actual
power) and the peak power P
1
of the pick-up and compare these values with the char-
acteristic curves. To do so, you must know the installation conditions of the pick-up.
Installation require-
ments
• Installation condition 1 (E
1
):
– The line cable is routed in the floor.
– The horizontal surface of the pick-up can give off heat via free convection (
→
in-
stallation correction factor f
E1
= 1.0).
• Installation condition 2 (E
2
):
– The line cable is routed in the floor.
– Slight air movement (0.5 ms
–1
) over the entire surface of the pick-up
(
→
installation correction factor f
E2
= 1.25).
Determining the
peak power
What peak power P
1
can you expect with a given continuous power P
2
?
• You can determine the temperature rise
∆ϑ
compared to the ambient temperature by
means of the temperature rise factor k
1
and the continuous power P
2
of the pick-up.
• You can now use the ambient temperature
ϑ
to determine the pick-up temperature
ϑ
K
:
Result:
• When the pick-up temperature
ϑ
K
is below 65 °C, the peak power P
1
is available.
• When the pick-up temperature
ϑ
K
is between 65 °C and 85 °C, you can interpolate
linearly between peak power and continuous power.
• When the pick-up temperature
ϑ
K
is > 85 °C, you will have to use another character-
istic curve with a smaller temperature rise factor k
1
.
2716711691
2716714763
Δϑ=
×
k P
1
2
1000
ϑ
ϑ Δϑ
K
= +
P
i
f
kVA
Hz
n
Summary of Contents for MOVITRANS THM20C
Page 2: ...SEW EURODRIVE Driving the world ...
Page 60: ......
Page 61: ......
Page 62: ......
Page 63: ......


