


Instrument tour
R&S
®
ZND
25
Getting Started 1316.2407.02 ─ 62
The following sections contain further useful information about manual control of the
instrument.
●
Refer to the other sections in chapter
Chapter 5, "Operating the instrument"
on page 31 to learn how to handle traces and diagrams, and how to use menus,
keys and softtools.
●
Refer to chapter "Concepts and Features" in the user manual or help system to
obtain information about the results in the diagram.
●
Refer to section "Display Menu" in the user manual or help system to learn how to
customize the screen.
●
Refer to the data sheet for the technical specifications of the display.
Screen saver
The screen saver function of the operating system can be used to switch off the display
if the analyzer receives no command for a selectable period of time. The display is
switched on again if any front panel key is pressed.
To enable the screen saver, access the Windows
®
operating system (e.g. by pressing
the Windows key in the SYSTEM keypad) and tap "Control Panel > Power Options >
Change Plan Settings > Turn off the display".
(Windows 7: "Control Panel > Hardware and Sound > Power Options > Edit Plan Set-
tings > Turn off the display").
4.1.2
Function keys
Most of the keys in the TRACE, CHANNEL, STIMULUS, and SYSTEM keypads call up
a related softtool of the analyzer GUI. Every softtool provides access to a group of rela-
ted measurement settings.
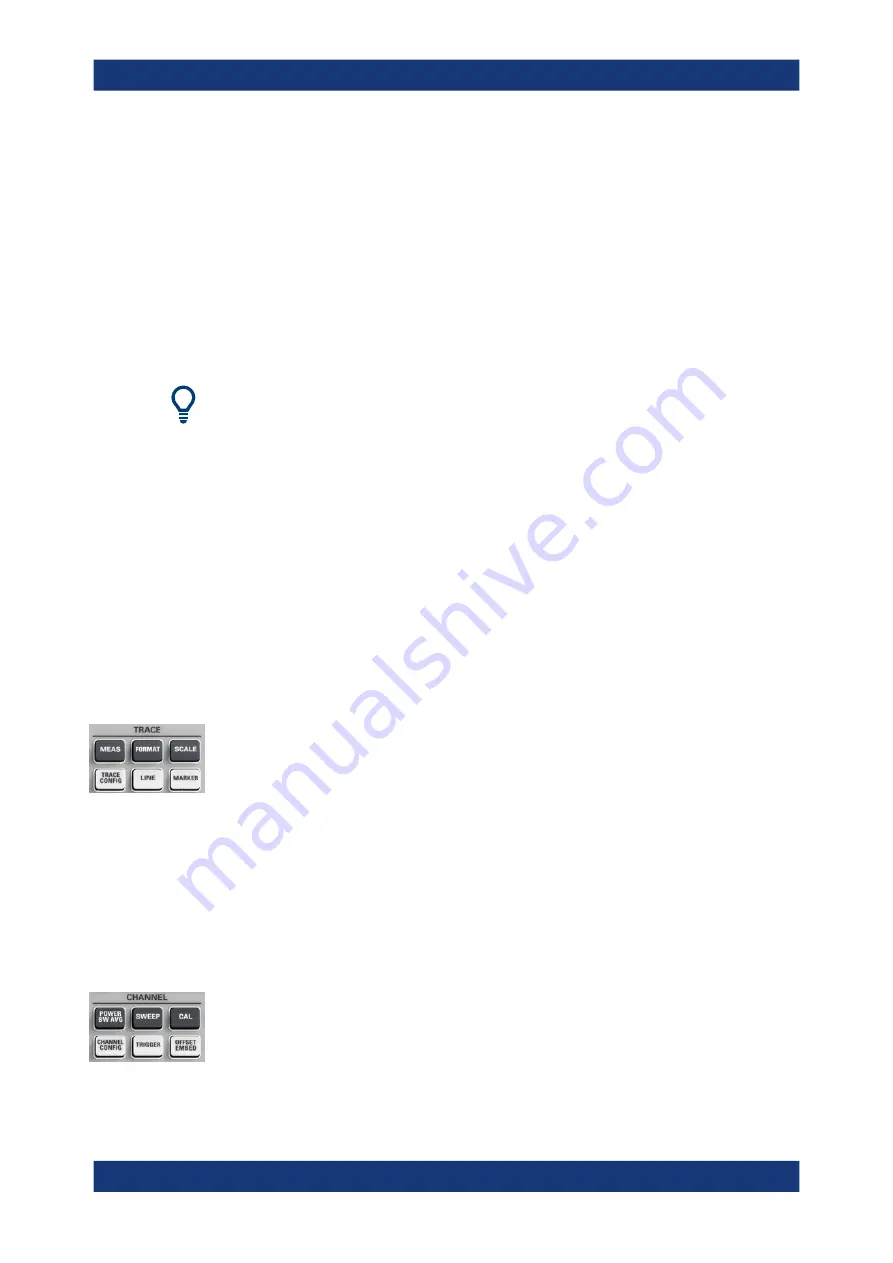
The TRACE keys give access to all trace settings, to the limit check settings, and to
the marker functions including marker search.
●
The [MEAS] settings select the measured and displayed quantity.
●
The [FORMAT] settings define how measured data (traces) are presented.
●
The [SCALE] settings define how traces are scaled.
●
The [TRACE CONFIG] settings store traces to the memory and perform mathemat-
ical operations on traces.
●
The [LINES] settings define limits for the measurement results, visualize them in
the diagrams and activate/deactivate the limit check.
●
The [MARKER] settings position markers on a trace, configure their properties and
select the format of the numerical readout. Markers can also be used to locate spe-
cific points on the trace, define the sweep range, and scale the diagram.
The CHANNEL keys give access to the hardware-related (channel) settings.
●
The [POWER BW AVG] settings define the power of the internal signal source, the
IF bandwidth, and the sweep average.
●
The [SWEEP] settings define the scope of measurement, including the sweep type
and the number of measured sweeps.
Front panel


