


The Receiver Application
R&S
®
FPC
136
User Manual 1178.4130.02 ─ 07
3. Press the "Trace" key to open the trace menu.
4. Select the "Trace <x>" menu item to select one of bargraphs.
5. Configure both bargraphs as you like.
15.1.2
Frequency Scan
Access
: "Meas" > "Frequency Scan"
Access
(trace style): "Trace" > "Trace Style: <x>"
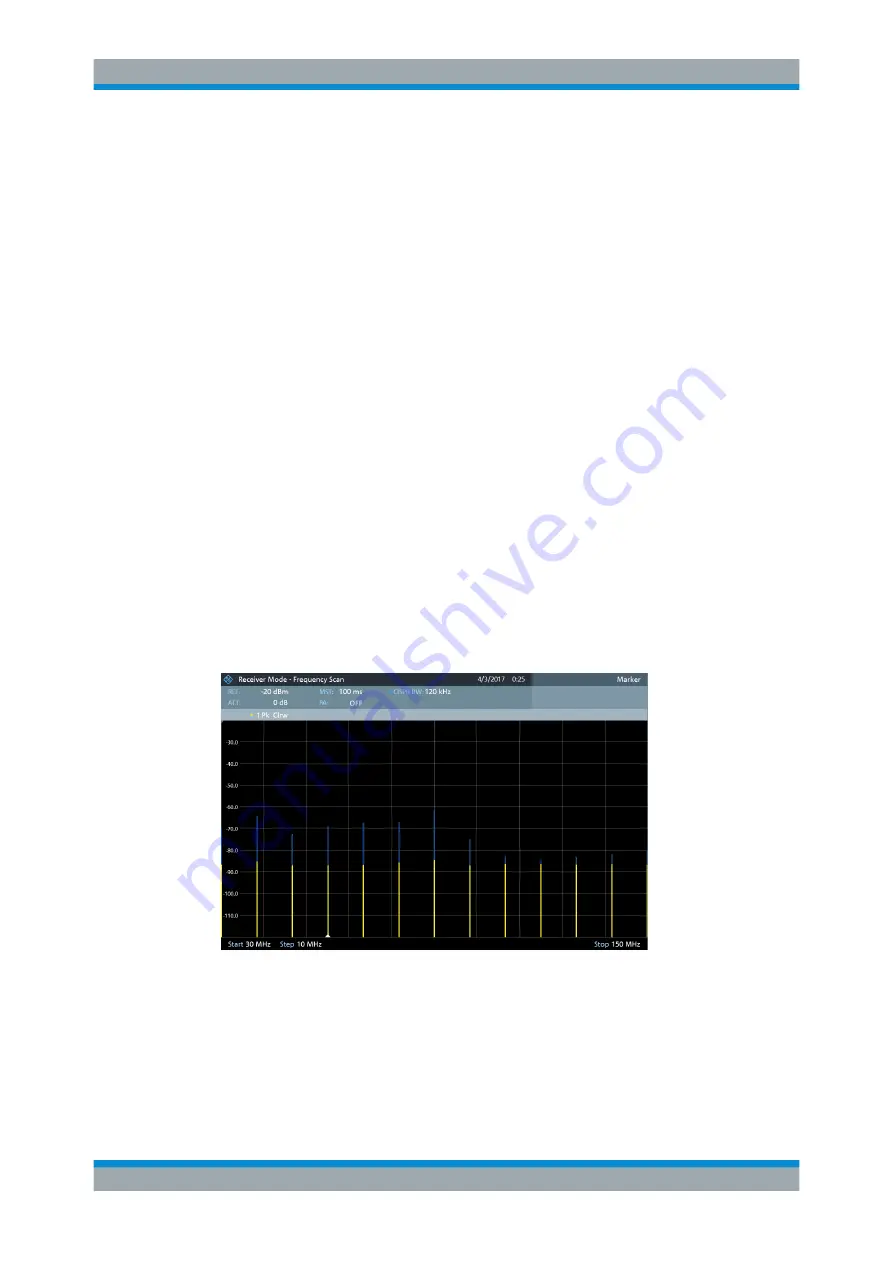
Compared to bargraph measurements, frequency scans measure a certain set of
receiver frequencies. The scan measures only those frequencies that are defined in
the
. The space between the receiver frequencies is not considered in
the measurement.
The R&S
FPC shows the results for a frequency scan in a graphical result display. The
horizontal axis in that display represents the frequency spectrum covered by the scan.
The vertical axis represents the signal level.
The signal levels for each frequency measured during the scan are represented by a
vertical line at the receiver frequencies that have been measured. This type of display
emphasizes the fact that the scan measures single receiver frequencies only and not
the frequencies between those receiver frequencies.
Yellow lines (or green lines if you display a second trace) indicate the current signal
level. Blue lines indicate the highest level that has been measured since the measure-
ment was started (
Figure 15-2: Fixed frequency scan in the range from 30 MHz to 150 MHz with a stepsize of 10 MHz
Selecting frequency scans
1. Press the "Meas" key to open the measurement menu.
2. Select the "Frequency Scan" menu item.
Measurements and Result Displays


