


Chapter 6: Using the Web Interface
51
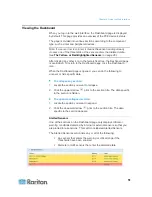
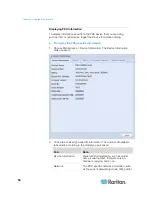
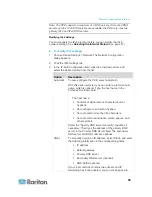
Viewing the Dashboard
When you log in to the web interface, the Dashboard page is displayed
by default. This page provides an overview of the PXE device's status.
The page is divided into various sections according to the component
type, such as inlet and peripheral devices.
Note: If a sensor row is colored, it means the sensor reading already
crosses one of the thresholds or the sensor enters the alarmed state.
See
The Yellow- or Red-Highlighted Sensors
After clicking any other icon in the hierarchical tree, the Dashboard page
is overridden. To return to the Dashboard page, click the Dashboard
icon.
When the Dashboard page is opened, you can do the following to
uncover or hide specific data.
To collapse any section:
1. Locate the section you want to collapse.
2. Click the upward arrow
prior to the section title. The data specific
to the section is hidden.
To expand a collapsed section:
1. Locate the section you want to expand.
2. Click the downward arrow
prior to the section title. The data
specific to the section appears.
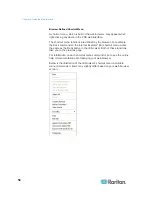
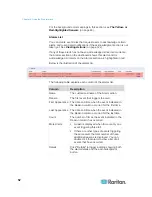
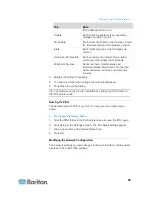
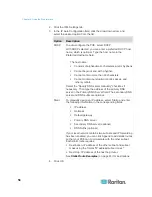
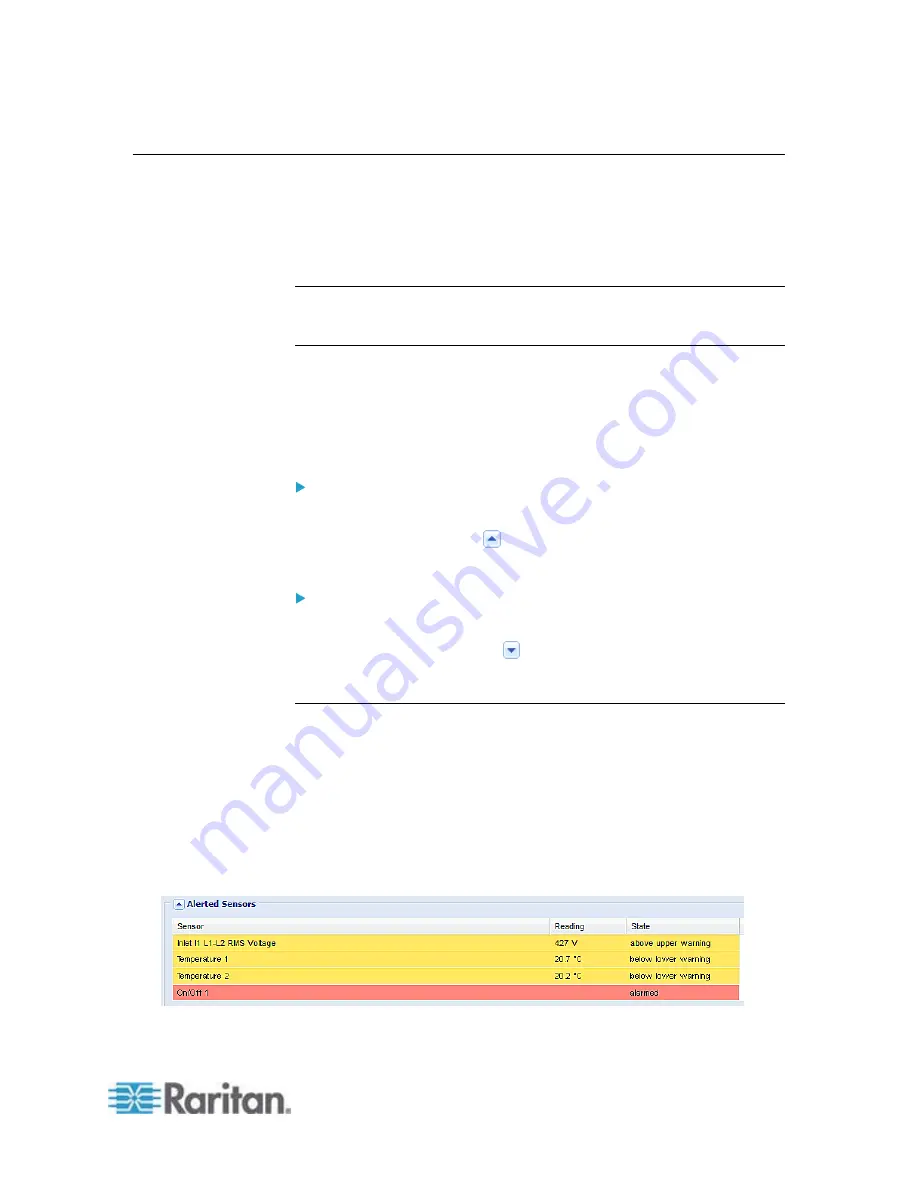
Alerted Sensors
One of the sections on the Dashboard page only displays critical or
warning conditions detected by internal or external sensors so that you
are alerted to take actions. This section is labeled Alerted Sensors.
The Alerted Sensors section lists any or all of the following:
Any sensor that enters the warning or critical range if the
thresholds have been enabled
Discrete (on/off) sensors that enter the alarmed state
Summary of Contents for PXE
Page 16: ......
Page 339: ...Appendix A Specifications 323 RS 485 Pin signal definition al 4 5 6 D bi direction al Data 7 8...
Page 380: ...Index 364 Z Zero U Products 1...
Page 381: ......


