


Operating the instrument
R&S
®
RTE
82
Getting Started 1326.1026.02 ─ 10
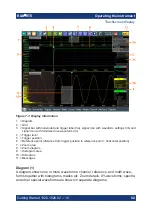
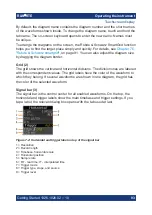
Figure 7-1: Display information
1 = Diagram
2 = Grid
3 = Signal bar with horizontal and trigger label (3a), signal icon with waveform settings (3b) and
signal icon with minimized live waveform (3c)
4 = Trigger level
5 = Trigger position
6 = Reference point (distance from trigger position to reference point = horizontal position)
7 = Zoom area
8 = Zoom diagram
9 = Histogram area
10 = Histogram
11 = Messages
Diagram (1)
A diagram shows one or more waveforms: channel, reference, and math wave-
forms together with histograms, masks etc. Zoom details, XY-waveforms, spectra
and other special waveforms are shown in separate diagrams.
Touchscreen display


