


Operating the instrument
R&S
®
RTE
100
Getting Started 1326.1026.02 ─ 10
Histogram
The histogram icon on the toolbar shows the last selected histo-
gram type. A short tap on the icon activates the selected histogram.
If you touch the icon and drag your finger down, a menu opens where you can
select another histogram type: horizontal histogram, or vertical histogram.
Tap the icon and then drag a rectangle on the diagram to mark the histogram
area. The histogram for the selected waveform appears.
Touch and hold the histogram area to open the "Histogram" dialog box.
Measurement
Starts an automatic measurement.
You can run up to 8 automatic measurements in parallel. The "Automatic measur-
ment" icon starts the measurements one after the other.
Tap the icon and then tap the diagram with the waveform to be measured. To
define a measurement gate, draw a rectangle on the screen.
To modify the measurement, tap the
icon in the "Measurement" result box.
Quick meas
Performs a set of measurements on the selected waveform. You can con-
figure up to 8 measurement type to be included in quick measurement.
Tap the icon and then tap the diagram with the waveform to be measured.
FFT
Transforms a waveform to the frequency spectrum by fast Fourier trans-
form (FFT). The FFT trace is shown in a new diagram.
Tap the icon and then tap diagram with the waveform to be transformed. The FFT
diagram is created from the selected waveform.
To adjust FFT settings, double-tap the FFT diagram.
Select
Enables the select mode to move and modify objects on the touchscreen.
The select mode is activated automatically when an analyzing function is comple-
ted.
Delete
Removes zoom and histogram areas and their diagrams; measurement
areas and their associated results; and mask segments. The icon also switches
off a waveform.
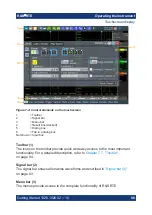
Toolbar


