background image

R&S FS300 

Spectrum Analyzer 


Operating manual, 02/2006 

6-115 

E-1007.9900.15 

6.2.3.6.1 

Entering the Peak Excursion 

Use 

If NEXT PEAK LEFT or NEXT PEAK RIGHT is selected, these functions 
search for the next relative maximum left or right of the current marker posi-
tion irrespective of the current signal amplitude. When the signal level de-
creases for a definite amount, the peak excursion, to either side of the maxi-
mum a relative maximum is given.


Entering the 
peak excursion 

1. 

Press the 


function key

 in the 


submenu.


An entry field containing the current setting is displayed. The default set-
ting is 6 dB. 


2. 

Enter a new value in 0.1 dB steps (  5-60). 
The entry range for the reference-point level is: 

≤ 

 Peak Excursion 

≤ 

80 dB 

The new setting is saved and it is the current search criterion when you 
use the functions NEXT PEAK LEFT/RIGHT (  6-99).


Examples of level 
measurement with 
different settings of 
PEAK EXCURSION


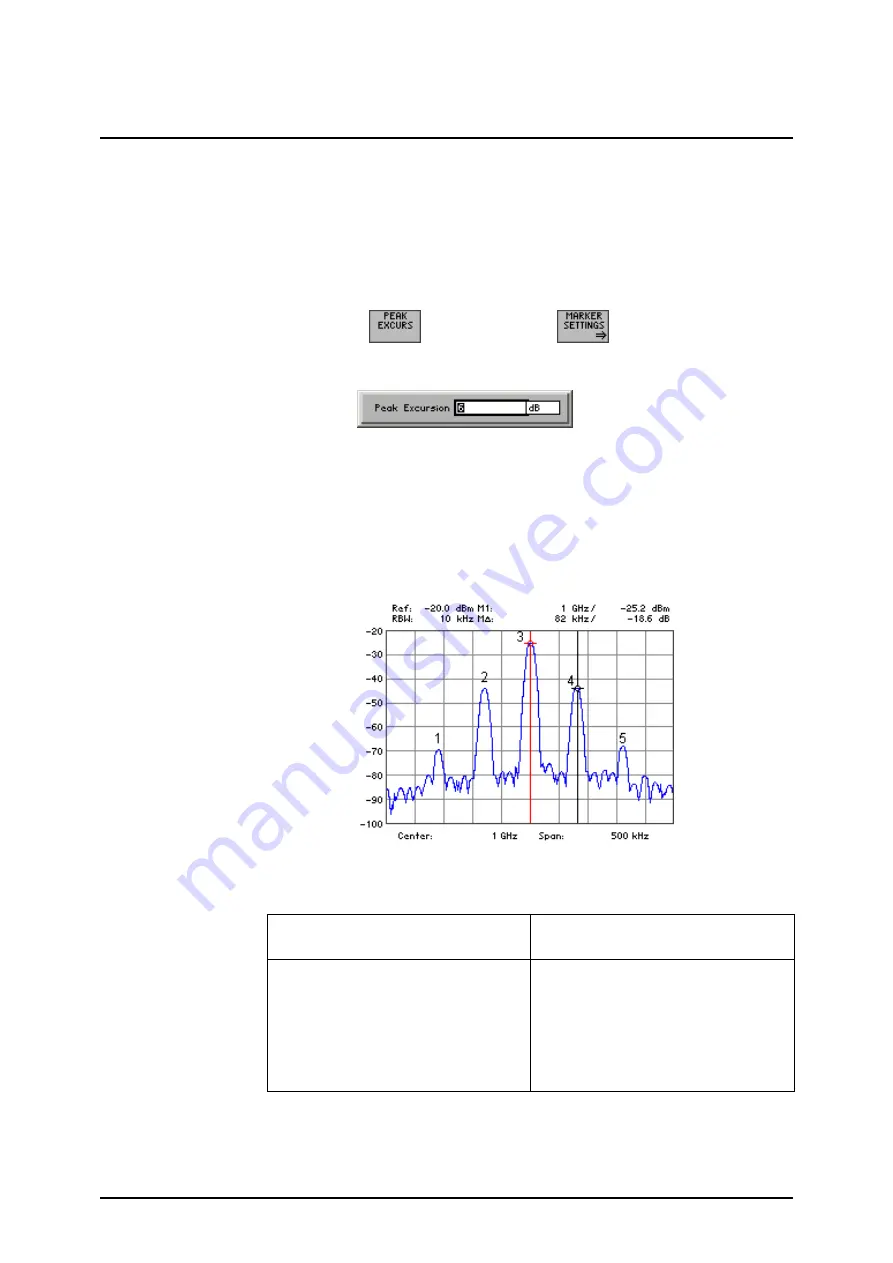
The following example illustrates the effect of different settings of the PEAK 
EXCURSION. 


The following table lists the signals as indicated by numbers in the measuring 
diagram above, as well as the minimum of the amplitude decrease to both 
sides of the signal: 


Signal # 

Min. amplitude decrease to both 

sides of the signal 


10 dB 


35 dB 


48 dB 


35 dB 


10 dB 

Summary of Contents for FS300

Page 1: ...2 2006...

Page 2: ...SCHWARZ GmbH Co KG Test and Measurement Division M hldorfstra e 15 81671 M nchen Germany 13th edition 2 2006 Printed in Germany Printed on FFC bleached paper Subject to alterations Errors excepted Re...

Page 3: ...Certificate of Conformity Support Center Address List of Rohde Schwarz Offices Chapter 1 Introduction Chapter 2 Control Elements Chapter 3 Putting the R S FS300 into Operation Chapter 4 Getting Starte...

Page 4: ...characteristics of the instrument Putting into operation Basic operating procedures and control elements Operation via menus and remote control By way of an introduction a typical R S FS300 measureme...

Page 5: ...ess 0 31 List of Rohde Schwarz Offices 0 32 1 Introduction 1 38 1 1 Applications for the R S FS300 1 38 1 2 Supplied Accessories 1 39 1 3 Warranty 1 39 2 Control Elements 2 40 2 1 Front View 2 40 2 2...

Page 6: ...nt Functions 5 58 5 4 2 Selecting Settings 5 59 5 4 3 Entering Numerical Parameters 5 60 5 4 3 1 Entry with the Numerical Keys 5 60 5 4 3 2 Entry using the Cursor Keys and the Rotary Knob 5 62 5 5 Ove...

Page 7: ...ng off Measured Values with Marker 2 6 103 6 2 3 2 2 Reading off Level Differences 6 104 6 2 3 3 Accepting Marker Values as Settings 6 105 6 2 3 3 1 Moving Trace Sections in the Measurement Diagram 6...

Page 8: ...of Day 6 166 6 3 4 2 Selecting an Internal or External Reference Source 6 168 6 3 4 3 Configuring the Instrument Interfaces 6 169 6 3 4 4 Setting the Screen Saver Mode 6 171 6 3 4 5 Selecting an Inte...

Page 9: ...211 7 5 4 Setting the Parameters 7 212 7 5 4 1 Direct Selection of a Instrument Function 7 212 7 5 4 2 Selecting the Settings 7 213 7 5 4 3 Inputting the Numerical Parameters 7 213 7 5 4 4 Moving the...

Page 10: ...7 8 2 Changing the Window Color 7 238 7 9 Getting Help 7 239 7 9 1 Starting the Help 7 239 7 9 2 Displaying the Program Version 7 239 7 9 3 Displaying Module Data 7 240 8 Instrument Interfaces 8 241...

Page 11: ...5 to 30 C 1 10 6 Frequency counter Resolution 1 Hz 10 Hz 100 Hz 1 kHz Frequency span 1 kHz to 3 GHz 0 Hz Spectral purity SSB phase noise 10 kHz offset from carrier 90 dBc 1 Hz Residual FM 1 kHz resol...

Page 12: ...d 0 dB RF attenuation 85 dBm Other input related spurious 10 MHz to 3 GHz 30 dBm level at 1st mixer 60 dBc Displayed average noise level 300 Hz resolution bandwidth 10 Hz video bandwidth 0 dB RF atten...

Page 13: ...e Inputs RF Input Connector type N female Input impedance 50 VSWR 10 MHz to 3 GHz RF attenuation 20 dB 1 5 Max input power with 30 dB RF attenuation 33 dBm Maximum permitted DC voltage 30 V External t...

Page 14: ...type B Plug USB protocol version 1 1 Power Supply AC supply 100 to 240 V AC 50 to 60 Hz autoranging Power consumption 35 VA General Data Display Type 5 4 active color TFT display Resolution 320 x 240...

Page 15: ...0 5g const Random meets DIN EN 60068 2 64 10 to 500 Hz 1 9g Shock meets DIN EN 60068 2 27 and MIL STD 810 shock spectrum Electromagnetic compatibility meets EN 55011 class B and EN 61326 EMC directiv...

Page 16: ......

Page 17: ...ory environments or in the field and must not be used in any way that may cause personal injury or property damage You are responsible if the product is used for an intention other than its designated...

Page 18: ...pplications in the European Economic Area Definitions that deviate from the standard definition may also exist It is therefore essential to make sure that the tags described here are always used only...

Page 19: ...observe the relevant safety instructions in the product documentation 6 Depending on the function certain products such as RF radio equipment can produce an elevated level of electromagnetic radiation...

Page 20: ...e connections with information technology equipment comply with IEC 950 EN 60950 18 Never remove the cover or part of the housing while you are operating the product This will expose circuits and comp...

Page 21: ...the product on surfaces vehicles cabinets or tables that for reasons of weight or stability are unsuitable for this purpose Always follow the manufacturer s installation instructions when installing...

Page 22: ...rmaciones de seguridad Adem s queda en la responsabilidad del usuario utilizar el producto en la forma debida Este producto solamente fue elaborado para ser utilizado en la ind stria y el laboratorio...

Page 23: ...las informaciones para la protecci n de personas que encontrar n en otro cap tulo de esta documentaci n y que tambi n son obligatorias de seguir En las informaciones de seguridad actuales hemos junta...

Page 24: ...hoja de datos se aplicar una tolerancia de 10 sobre el voltaje nominal y de 5 sobre la frecuencia nominal 2 En todos los trabajos deber n ser tenidas en cuenta las normas locales de seguridad de traba...

Page 25: ...rotegidas personas embarazadas debidamente Tambi n las personas con un bypass pueden correr peligro a causa de la radiaci n electromagn tica El empresario est comprometido a valorar y se alar areas de...

Page 26: ...rcuitos de corriente con una tensi n de entrada de Ueff 30 V se deber tomar las precauciones debidas para impedir cualquier peligro por ejemplo medios de medici n adecuados seguros limitaci n de tensi...

Page 27: ...los acumuladores solamente por los del tipo R S correspondiente ver lista de piezas de recambio Bater as y acumuladores son deshechos problem ticos Por favor tirenlos en los recipientes especiales pa...

Page 28: ...n movimiento si esto pudiera distraer al conductor Siempre queda en la responsabilidad absoluta del conductor la seguridad del veh culo y el fabricante no asumir ninguna clase de responsabilidad por a...

Page 29: ...ured of receiving a product that is manufactured using the most modern methods available This product was developed manufactured and tested in compliance with our quality manage ment system standards...

Page 30: ...68 EEC relating to electromagnetic compatibility 89 336 EEC revised by 91 263 EEC 92 31 EEC 93 68 EEC Conformity is proven by compliance with the following standards EN61010 1 2001 12 EN55011 1998 A1...

Page 31: ...eselection or request the desired information and upgrades via email from your Customer Support Center addresses see below Feedback We want to know if we are meeting your support needs If you have any...

Page 32: ...rohde schwarz com R S Systems GmbH Graf Zeppelin Stra e 18 51147 K ln Tel 49 2203 49 0 Fax 49 2203 49 5 23 36 info rssys rohde schwarz com ADRESSEN WELTWEIT ADDRESSES WORLDWIDE siehe see Austria Alba...

Page 33: ...100 Fax 45 9637 3101 rsdk rsdk rohde schwarz com Denmark Rohde Schwarz Technology Center A S Gasvaerksvej 26 9000 Aalborg Tel 45 96738 888 Fax 45 96738 889 Denmark U A S Universal Advanced Systems 31...

Page 34: ...86 798 david_hasky easx co il Israel J M Moss Engineering Ltd Communications Products 9 Oded Street P O Box 967 52109 Ramat Gan Tel 972 3 631 20 57 Fax 972 3 631 40 58 jmmoss zahav net il Israel Rohde...

Page 35: ...9 ND Nieuwegein Tel 31 30 600 17 00 Fax 31 30 600 17 99 info rsn rohde schwarz com Netherlands Nichecom 1 Lincoln Ave Tawa Wellington Tel 64 4 232 32 33 Fax 64 4 232 32 30 rob nichecom co nz New Zeala...

Page 36: ...udan Rohde Schwarz Sverige AB Flygf ltsgatan 15 128 30 Skarpn ck Tel 46 8 605 19 00 Fax 46 8 605 19 80 info rss rohde schwarz com Sweden Roschi Rohde Schwarz AG M hlestr 7 3063 Ittigen Tel 41 31 922 1...

Page 37: ...Rohde Schwarz Inc R D and Application Support 8905 SW Nimbus Ave Suite 240 Beaverton OR 97008 Tel 1 503 403 47 00 Fax 1 503 403 47 01 info rsa rohde schwarz com USA Rohde Schwarz Inc Western Regional...

Page 38: ...stringent requirements laid down for RF communication systems are met it is essential to have measuring equipment that can pre cisely measure and analyze the modulated and unmodulated signals in volve...

Page 39: ...and mechanical protection Warranty conditions The General Terms and Conditions of Rohde Schwarz shall apply Returning a defective R S FS300 You will find the addresses of your nearest R S representat...

Page 40: ...ol Elements 2 1 Front View 1 ON STANDBY switch 2 ON STANDBY indicator 3 SYS key 4 ESC CANCEL key 5 ENTER key 6 Cursor keys 3 4 7 Cursor keys 6 5 8 RF IN RF input connector 9 Unit keys 10 Rotary knob 1...

Page 41: ...signal 15 Connector for external USB host 16 Output connector for USB device e g printer 17 Power supply connector 18 AC line fuses 19 AC line switch 20 Connector for external monitor 21 Connector for...

Page 42: ...e checks are not performed 3 1 Unpacking the R S FS300 Recommended procedure When you unpack the R S FS300 proceed as follows 1 Remove the R S FS300 from its packaging and check that the delivery is c...

Page 43: ...n it with a turning action 2 Slide the handle lengthwise while twisting it radially in steps of about 12 3 Close the setting lever by pressing on the outer surface ATTENTION There is a risk of injury...

Page 44: ...tor 17 is at the rear of the instrument 2 Connect the power cord to the AC line 3 4 Switching On the R S FS300 NOTE The AC line is still connected to the R S FS300 when the instrument is in the standb...

Page 45: ...nd the red or the red or green LED flash alternately switch the R S FS300 off and on In case the error continues return the instrument to our service center for checking If the instrument shows an err...

Page 46: ...ise malfunctions may occur at a later date Use You can connect an external PC keyboard via the 6 pin PS 2 KEYBOARD connector 21 on the R S FS300 s rear panel The keyboard makes it easier to enter file...

Page 47: ...ted by the R S FS300 the stick must be formatted in the FAT32 file system Use You can connect an external USB stick to the USB device interface 16 at the rear of the R S FS300 The USB stick is an exte...

Page 48: ...e screen are also described Chapter 6 describes all the R S FS300 s menus and the associated func tions in detail 4 1 Level and Frequency Measurements 4 1 1 Measurement Task ATTENTION The input stage...

Page 49: ...ar using the cursor keys Press the function key Enter using the numerical keys Terminate the entry by pressing the unit key 4 Reduce the SPAN to 1 MHz Stay in the menu Press the function key Enter fro...

Page 50: ...rotary knob The keypad comprises the following sections Numerical keys 11 Unit keys 9 Cursor keys 6 7 Function keys 12 Action keys 4 5 SYS key 3 5 1 1 Numerical Keys Function The numerical keys are u...

Page 51: ...lowing functions Navigating through menus and selection fields The 3 or4 cursor keys move the cursor to the position you want within the numerical editing line The 6 or 5 cursor keys increment or decr...

Page 52: ...ll also terminate the entry of setting data This key is for closing the entry field or selection field but the data that has been entered is not saved in other words the old value is retained 5 1 7 SY...

Page 53: ...ormation about events and the parame ters associated with the selected measurement functions The display mode for the measurement results the lettering of the function keys and the type of menu all de...

Page 54: ...is superimposed on the diagram area to make it easier to ana lyze traces Parameter field and status display The following are displayed in the parameter field Ref upper diagram limit reference level R...

Page 55: ...n area The displayed instrument functions are assigned to the seven function keys down the right hand side of the screen If a key in the function area does not have any lettering the key has not been...

Page 56: ...select are displayed in the function area Pressing a function key has one of the following effects Direct execution of an instrument function Opening of entry or selection windows Opening of submenus...

Page 57: ...5 Calling quitting submenus 2 Press the function key in the menu The MARKER 1 submenu opens and the new functions are assigned to the function keys 12 3 Press the function key in the submenu The subme...

Page 58: ...be used to select and enter in strument parameters 5 4 1 Direct Selection of Instrument Functions Introduction When you select a menu various instrument functions are displayed in the function area S...

Page 59: ...ey you select is highlighted e g Setting the level display range 6 90 1 Press the function key in the menu A selection field containing the available settings is displayed The de fault setting is 80 d...

Page 60: ...ys and rotary knob The entry with the cursor keys and rotary knob is useful if you only have a rough idea of what the measurement parameters should be As the screen is continuously updated as the valu...

Page 61: ...e unit you can terminate the entry with the ENTER key or one of the unit keys 3c Press the ESC CANCEL key 4 to abort the entry The old value is retained The entry window is closed Invalid parameter en...

Page 62: ...pressing the 6 cursor key once decrements the value by one 6 3b Turn the rotary knob 10 until you obtain the value you want Turning clockwise increases the value turning counter clockwise re duces th...

Page 63: ...or always has the same unit you can terminate the entry with the ENTER key or one of the unit keys 4c Press the ESC CANCEL key 4 to abort the entry The old value is retained The entry window is close...

Page 64: ...he submenu Setting the step size manually 6 80 Setting the step size automatically 6 80 Setting the step size to the center frequency 6 80 Setting the step size to the marker frequency 6 80 Open subme...

Page 65: ...nction key assignment Entering the reference level 6 88 Entering a level offset 6 89 Selecting the level display range 6 90 Selecting a unit for the level display 6 91 Setting the RF input attenuation...

Page 66: ...resolution 6 101 De activate marker 1 6 99 Open submenu Activate marker 2 Quitting the submenu Place marker 2 on the trace maximum 6 103 Place marker 2 on the next trace maximum to the left 6 103 Plac...

Page 67: ...screen 6 113 Open submenu Search criterion of functions NEXT PEAK LEFT RIGHT Quitting the submenu Entering the peak excursion 6 115 Open submenu Reference points for measuring level differences Quitti...

Page 68: ...123 Open submenu Setting the RBW VBW coupling ratio Quitting the submenu Setting the coupling ratio RBW VBW manually 6 125 Activating the default setting for the coupling ratio RBW VBW 6 125 Switching...

Page 69: ...nd activating Trace 1 6 132 Turning on and activating Trace 2 6 132 Trace display mode Overwrite mode 6 134 Trace display mode Min Max hold 6 134 Trace display mode Averaging 6 134 Freezing the trace...

Page 70: ...ion key assignment Free running measurements 6 141 Open submenu Triggering by an external TTL signal Quitting the submenu Triggering on positive going edge 6 144 Triggering on negative going edge 6 14...

Page 71: ...he time domain ZERO SPAN Quitting the submenu Output the peak value within the section 6 147 Output the mean value within the section 6 147 Insert a vertical line to limit the lower left part of a sec...

Page 72: ...trument setting 6 155 5 5 2 3 FILE Menu Function key assignment Saves a user defined setting waveform 6 157 6 159 Loads a user defined setting waveform 6 157 6 159 Prints out a screenshot 6 157 5 5 2...

Page 73: ...view of all Menus and Functions Operating manual 02 2006 5 73 E 1007 9900 15 5 5 2 6 INFO Menu Function key assignment Displays module data 6 176 Displays instrument statistics 6 176 Displays system m...

Page 74: ...g on for the first time When you switch on the R S FS300 3 44 the settings you were using when the instrument was last switched off are restored When you switch on for the first time the factory defau...

Page 75: ...nterface is activated The following is displayed on the screen 13 Menus for configur ing and starting measurements The menus used to set the spectrum analyzer are displayed in the menu area The order...

Page 76: ...3 or 4 cursor key 6 The menu name is highlighted and the appropriate functions are as signed to the function keys Function key assignment 1st variant Setting the frequency range 6 77 Enter the center...

Page 77: ...ting is displayed 2 Enter the new value 5 60 The entry range for the center frequency is 500 Hz Center 2 9999995 GHz Setting the span 3 Press the function key in the menu An entry field containing the...

Page 78: ...nter the new value 5 60 The entry range for the start frequency is 0 Start 2 999999 GHz Entering a stop frequency 3 Press the function key in the menu An entry field containing the current setting is...

Page 79: ...key in the menu The submenu opens and the appropriate functions are assigned to the function keys Function key assignment Quitting the submenu Setting the step size manually 6 80 Setting the step size...

Page 80: ...com pared with the span select the automatic setting mode Press the function key in the submenu The step size is set to a tenth of the current span Setting the step size to the center frequency If you...

Page 81: ...u require If you switchover to the time domain ZERO SPAN you can display the amplitude of the carrier signal as functions of time Selecting the SPAN SETTINGS submenu Press the function key in the menu...

Page 82: ...ed to swap backwards and forwards between an overview measurement FULL SPAN and a detailed measurement LAST SPAN e g center frequency and span set manually Displaying the whole frequency range 1 Press...

Page 83: ...Press the function key in the menu An entry field containing the current setting is displayed 2 Enter the frequency of the signal component you want to display in the time domain 6 77 Switching over t...

Page 84: ...ains the same Increasing the span Press the function key in the submenu The span is increased by a factor of two The center frequency remains the same The center frequency will be adapted if the new d...

Page 85: ...hanging slowly in comparison with the sweep time can be kept in the center of the screen The capture range of the function is span 5 referring to the center frequency The spectrum ana lyzer s center f...

Page 86: ...be measured over long periods Activating signal tracking Press the function key in the submenu The center frequency is constantly adjusted so that the signal peak is al ways in the middle of the scre...

Page 87: ...lighted and the appropriate functions are as signed to the function keys 12 Function key assignment Entering the reference level 6 88 Entering a level offset 6 89 Selecting the level display range 6 9...

Page 88: ...e level entries 6 91 The default setting is dBm Entering the reference level 1 Press the function key in the menu An entry field containing the current setting is displayed The default set ting is 20...

Page 89: ...urrent setting is displayed The default set ting is 0 dB 2 Enter a new value in 0 1 dB steps 5 60 The entry range for the level offset is 100 dB Ref Lvl Offset 50 dB The new setting is saved and displ...

Page 90: ...100 corresponds to the reference level 0 to 0 V or 0 W Entering the level display range 1 Press the function key in the menu A selection field containing the available settings is displayed The de fau...

Page 91: ...field containing the available settings is displayed The de fault setting is dBm 2 Select a unit for the level display with rotary knob 10 3 Press the ENTER key 5 to close the selection field The new...

Page 92: ...yed in the selected unit There is no grid lettering The values shown by the level markers and the relevant level entries are in the selected unit Linear display RANGE in xV or xW The letter x is a wil...

Page 93: ...ssary to adjust the input attenuation manually with input attenuations from 0 to 70 dB Setting the input attenuation manually 1 Press the function key in the menu A selection field containing the avai...

Page 94: ...e R S FS300 s input mixer from being overloaded There are three RF input modes you can choose from coupling between reference level and input attenuation to op timize measurements NORMAL Normal settin...

Page 95: ...ion key in the menu A selection field containing the available settings is displayed The de fault setting is NORMAL 2 Using the rotary knob 10 select a criterion for autosetting the input attenuation...

Page 96: ...00 Sets the reference level REF LEVEL 6 88 to 10 dBm if RF ATTEN was set to AUTO the analyzer switches to MANUAL Sets the input attenuation RF ATTEN 6 93 to 0 dB if RES BW was set to MANUAL the analyz...

Page 97: ...enu with the 3 or 4 cursor key 6 The menu name is highlighted and the appropriate functions are as signed to the function keys 12 Function key assignment Open submenu Activate marker 1 6 98 Open subme...

Page 98: ...ion Selecting the MARKER 1 submenu Press the function key in the menu The submenu is opened and the appropriate functions are assigned to the function keys 12 Function key assignment Quitting the subm...

Page 99: ...1 Press the function key in the submenu Marker 1 is activated and placed on the current trace maximum M1 marker values are displayed in the parameter field Placing marker 1 on the next trace maximum...

Page 100: ...ith rotary knob 10 The current M1 marker values are displayed in the parameter field De activating marker 1 Press the function key in the submenu Marker 1 and marker 2 if activated disappears from the...

Page 101: ...M1 marker values are displayed in the parameter field 2 Press the function key in the submenu A selection field containing the available settings is displayed The de fault setting is 100 Hz 3 Select a...

Page 102: ...been activated Selecting the MARKER 2 submenu Press the function key in the menu The submenu is opened and the appropriate functions are assigned to the function keys 12 Function key assignment Quitti...

Page 103: ...marker NORM 1 Press the function key in the submenu Marker 2 is activated and placed on the trace maximum 2 Press the function key in the submenu Marker 2 is defined as a normal marker The M2 absolut...

Page 104: ...that have been set manually 6 117 can be used as reference points Activating marker 2 1 Press the function key in the submenu 2 Position marker 2 on the trace 6 102 The current M2 marker values are di...

Page 105: ...s only available when the markers are activated Selecting the MKR submenu Press the function key in the menu The submenu is opened and the appropriate functions are assigned to the function keys 12 Fu...

Page 106: ...he trace 1 Activate the markers 6 98 6 102 2 Press the or function key in the menu The selected marker is activated All further marker settings are for the active marker e g marker 1 3 Position the ac...

Page 107: ...ion key is not avail able Setting the reference level to the marker level 5 Press the function key in the submenu The current marker level is set as the reference level 6 88 The trace is shifted verti...

Page 108: ...elp of the rotary knob Positioning markers on the trace 1 Turn on the markers 6 98 6 102 2 Press the or function key in the menu The selected marker is activated All further marker settings are for th...

Page 109: ...the input signal to measure the noise power density and the signal bandwidth NOTE The function key is available only when the markers are turned on Selecting the submenu MKR FCTN Press the function k...

Page 110: ...ht and one to left of the marker and two points in the time domain one to the right and one to the left of the marker are used in the calculation to obtain a stable measurement result The values measu...

Page 111: ...s to form the reference for the bandwidth measurement 6 98 Measuring the signal bandwidth 2 Press the function key in the submenu An entry field containing the current attenuation setting of N dB is d...

Page 112: ...ual 02 2006 Terminating the measurement Press the function key in the submenu The signal or filter bandwidth measurement is terminated and the tempo rary markers T1 and T2 disappear from the screen Th...

Page 113: ...play line appears at the top edge of the diagram area REF LEVEL The lettering SCROLL or press ENTER is displayed and indicates that the display line can be moved up or down Moving the display line 4 C...

Page 114: ...he PEAK EXCURSION function key enables for level measurements the entry of a minimum level value by which a signal must fall so that it will be identified as a maximum by the NEXT PEAK LEFT and NEXT N...

Page 115: ...taining the current setting is displayed The default set ting is 6 dB 2 Enter a new value in 0 1 dB steps 5 60 The entry range for the reference point level is 0 Peak Excursion 80 dB The new setting i...

Page 116: ...level decreases at least by 35 dB to either side of this signal which is now greater than the peak excursion Order of signals detected PEAK signal 3 NEXT PEAK LEFT signal 2 NEXT PEAK LEFT signal 2 no...

Page 117: ...submenu Press the function key in the menu The submenu is opened and the appropriate functions are assigned to the function keys 12 Function key assignment Quitting the submenu Activate reference poi...

Page 118: ...n the parameter field The M2 marker values indicate the level difference referred to the reference point Activating entry of arbitrary reference points 1 Press the function key in the submenu It is no...

Page 119: ...he reference point form the fixed refer ence point for level difference measurements with the delta marker in the frequency domain 6 104 Entering a reference point time 4b Time domain display mode ZER...

Page 120: ...alues as reference points Press the function key in the submenu The reference values R disappear from the screen and the M1 marker values are again activated Marker 1 is positioned on the last referen...

Page 121: ...appropriate functions are as signed to the function keys 12 Function key assignment Setting the resolution bandwidth manually 6 122 Activating automatic resolution bandwidth setting 6 122 Setting the...

Page 122: ...nually set resolution bandwidths from 200 Hz to 1 MHz in a 1 2 3 5 10 sequence Setting the resolution bandwidth manually 1 Press the function key in the menu A selection field containing the available...

Page 123: ...ult setting is 1 MHz 2 Select a video bandwidth with rotary knob 10 3 Press the ENTER key 5 to close the selection field The new setting is saved and the selected video bandwidth is set Activating aut...

Page 124: ...unction key in the menu The submenu is opened and the appropriate functions are assigned to the function keys 12 Function key assignment Quitting the submenu Setting the coupling ratio RBW VBW manuall...

Page 125: ...VBW AUTO Setting the coupling ratio manually 1 Press the function key in the submenu An entry field containing the current setting is displayed The default set ting is 1 2 Enter a new value 5 60 The e...

Page 126: ...50 MHz 300 kHz 50 MHz SPAN 10 MHz 100 kHz 10 MHz SPAN 5 MHz 30 kHz 5 MHz SPAN 1 MHz 10 kHz 1 MHz SPAN 200 kHz 3 kHz 200 kHz SPAN 100 kHz 1 kHz 100 kHz SPAN 50 kHz 500 Hz 50 kHz SPAN 20 kHz 300 Hz 20...

Page 127: ...gnment Quitting the submenu Starting the continuous sweep 6 128 Performing an n times sweep 6 128 Setting the number of sweeps 6 128 Repeating an n times sweep 6 129 Setting the sweep time manually 6...

Page 128: ...the previous trace is cleared and a new frequency sweep n times is started Setting the number of sweeps 2 Press the function key in the submenu An entry field containing the current setting is display...

Page 129: ...Hz 137 833 ms RBW 1 MHz 24 825 ms 2 Enter a new value 5 60 The entry range for the sweep time is 0 ms Sweep Time 10 ms 3 Press the ENTER key 5 to close the entry field The new setting is saved and the...

Page 130: ...te functions are as signed to the function keys 12 Function key assignments Open submenu Selecting the active trace 6 131 Trace display mode Overwrite mode 6 134 Trace display mode Min Max Hold 6 134...

Page 131: ...ll be applied Selecting the SELECT TRACE submenu Press the function key in the menu The submenu opens and the appropriate functions are assigned to the function keys 12 Function key assignment Quittin...

Page 132: ...settings are for Trace 1 In the submenu press the function key if Trace 2 is turned on and active Trace 1 becomes the active trace All the following settings are for this trace The current display mo...

Page 133: ...key in the submenu Trace 2 is now active 2 Press the function key in the menu Trace 2 is blanked out 3 Press the function key in the submenu Trace 1 is activated and Trace 2 is turned off NOTE The cu...

Page 134: ...until all the signal components are displayed using a type of envelope curve AVERAGE Displays the average over several frequency sweeps This function is used to display the signal average over severa...

Page 135: ...han the previous value The current display mode e g MAX is displayed in the top left of the diagram area Displaying average values 1 Press the function key in the menu Averaging is activated The avera...

Page 136: ...left of the diagram area Freezing traces 1 Press the function key in the menu The current trace is frozen and displayed 2 Press the or function key in the menu when you want to update the trace Blanki...

Page 137: ...nce function for two traces Trace 1 Trace 2 from the MATH submenu and use this function to analyze the input signal Selecting the MATH submenu Press the function key in the menu The submenu opens and...

Page 138: ...traces The new ref erence for the difference trace is in the center of the measurement diagram 50 The difference trace can be moved within the measurement diagram by changing the reference Turning on...

Page 139: ...ent position in is displayed on the left above the reference line 4 Press the ENTER key 5 to terminate scrolling The text SCROLL disappears and Trace 1 is now in its new position The new setting is sa...

Page 140: ...s are as signed to the function keys 12 Function key assignment Free running measurement No explicit triggering of the start of measurement 6 141 Open submenu Triggering by an external TTL signal 6 14...

Page 141: ...nly available in time domain ZERO SPAN If the video trigger is used triggering on signals whose carrier amplitude is a function of time is possible This means that measurements can be made on bursts w...

Page 142: ...ggering by the AC line frequency This makes it possible to perform synchronized measurements on video sig nals for example which can even be triggered using the frequency of the AC line Press the func...

Page 143: ...the function key in the menu The submenu is opened and the appropriate functions are assigned to the function keys 12 Function key assignment Quitting the submenu Triggering on the rising edge of the...

Page 144: ...trigger edge b Press the function key in the submenu The measurement is started on every negative going edge of the trigger signal 6 2 6 3 Setting a Trigger Offset Use If the time difference between t...

Page 145: ...as well as the third order intercept point Selecting the MEAS menu Select the menu with the 3or 4 cursor key 6 The menu name is highlighted and the appropriate functions are as signed to the function...

Page 146: ...MEAN or the peak power PEAK Selecting the TIME DOMAIN PWR submenu Press the function key in the menu The submenu opens and the appropriate functions are assigned to the function keys 12 Function key a...

Page 147: ...A signals for example during the transmission phase or during the mute phase You can measure either the mean power MEAN or the peak power PEAK If both the switch on and the switch off phase of a burst...

Page 148: ...s T1 and T2 and displayed in the parameter field PEAK In the default setting these are the left T1 and the right T2 limit lines of the measurement diagram 3 Press the function key in the submenu The m...

Page 149: ...on T1 of the left limit line and the new measured pa rameter are displayed in the parameter field 3 Press the ENTER key 5 to terminate scrolling The SCROLL inscription disappears and the limit line is...

Page 150: ...calculated with the input signals at the same level Pn plus the measured value of an intermodulation product IP3 ad3 2 Pn When the TOI function is set and the markers are set to the input signals the...

Page 151: ...300 has been switched on and the selftest has run without detecting any faults the spectrum analyzer s user interface is activated 1 Press the SYS key 3 The measurement diagram and the parameter field...

Page 152: ...ual 02 2006 Menus for system and service functions Selects and calls the instrument s default setting 6 153 Displays the current instrument settings 6 155 Saves and loads user defined settings 6 156 S...

Page 153: ...user defined instrument setting as the instrument default setting and directly call it Selecting the PRESET menu 1 Press the SYS key 3 2 Select the menu with the 3 or 4 cursor key 6 The menu name is...

Page 154: ...57 2 Select the menu with the 3 or 4 cursor key 6 A table containing the available settings is displayed The current setting is marked with the sign x 3 Select a setting with the 5 or 6 cursor key 7 T...

Page 155: ...t settings are listed in a table Explanation of pa rameters CENTER Center frequency 6 77 SPAN Frequency span 6 77 START Start frequency for span 6 78 STOP Stop frequency for span 6 78 CF STEPSIZE Ente...

Page 156: ...n re quired from the FILE menu You can also print out a screenshot Selecting the FILE menu 1 Press the SYS key 3 2 Select the menu with the 3 or 4 cursor key 6 The menu name is highlighted and the app...

Page 157: ...the SAVE memory locations Saving user defined settings 1 Set up the R S FS300 for the measurement you want to perform 6 74 2 Press the function key in the menu A table containing the available setting...

Page 158: ...y memory location contains the factory setting 6 74 3 Press the ENTER key 5 The following message is displayed 4 Press the ENTER key 5 The setting you have selected is loaded 5 Press the SYS key 3 The...

Page 159: ...waveforms 1 Set up the R S FS300 for the measurement you want to perform 6 74 2 Press the function key in the menu A table containing the available settings is displayed memory locations 3 Select a s...

Page 160: ...ed memory locations 2 Select a setting with the 5 or 6 cursor key 7 The EMPTY memory location contains no waveform 3 Press the ENTER key 5 The following message is displayed 4 Press the ENTER key 5 Th...

Page 161: ...device connector or a USB stick is re quired Selecting an output unit 1 Press the function key in the menu A table containing the available parameters is displayed 2 Select the PRINTER parameter with...

Page 162: ...ct a printer for the output unit 6 161 3 Press the function key in the menu A table containing the available parameters is displayed 4 Select the PRINT SCREEN parameter with the 5 or 6 cursor key 7 5...

Page 163: ...parameter with the 5 or 6 cursor key 7 5 Press the ENTER key 5 An entry field for entering a file name is displayed The default setting is FS_Date_Time NOTE If you wish you can enter a new file name f...

Page 164: ...or 6 cursor key 7 4 Press the ENTER key 5 An entry field for entering a file name is displayed The default setting is FS_Date_Time NOTE If you wish you can enter a new file name from the numerical ke...

Page 165: ...n saver from the CONFIG menu Selecting the CONFIG menu 1 Press the SYS key 3 2 Select the menu with the 3 or 4 cursor key 6 The menu name is highlighted and the appropriate functions are as signed to...

Page 166: ...ify the parameters dd mm yyyy 24 h clock mm dd yyyy 12 h clock where d day m month y year Selecting the display format 1 Press the functions key in the menu A table containing the available parameters...

Page 167: ...n entry field containing the current setting is displayed 4 Enter a new value 5 60 5 Press the ENTER key 5 The setting is saved and displayed Setting the time 1 Press the function key in the menu A ta...

Page 168: ...e REF IN connector 22 is used as the input for an external frequency standard All the R S FS300 s internal oscillators are synchronized to this external reference fre quency also 10 MHz Selecting the...

Page 169: ...ble switching between the local control mode on the R S FS300 and remote control via PC This setting allows the instrument to automatically find a connected PC and switch immediately to remote control...

Page 170: ...again to remote con trol Setting the USB master selector 1 Press the function key in the menu The current USB master setting is displayed 2 Press the ENTER key 5 A selection field containing the avail...

Page 171: ...and the results are being dis played on the controller PC monitor the screen can be switched off picture The screen displays when the instrument is in remote control mode black The screen is switched...

Page 172: ...with rotary knob 10 5 Press the ENTER key 5 The setting is saved and the screen disconnection in the remote control mode is activated or de activated With the black setting the screen is of course bla...

Page 173: ...nnected monitor Selecting the monitor 1 If required connect a monitor to the MONITOR connector 20 2 Press the function key in the menu The current screen setting is displayed 3 Press the ENTER key 5 A...

Page 174: ...2 Select the menu with the 3 or 4 cursor key 6 The menu name is highlighted and the appropriate functions are as signed to the function keys 12 Function key assignment Performs a selftest 6 174 6 3 5...

Page 175: ...odule data instrument statistics and system messages from the INFO menu Selecting the INFO menu 1 Press the SYS key 3 2 Select the menu with the 3 or 4 cursor key 6 The menu name is highlighted and th...

Page 176: ...tion key in the menu A table listing the current modules and the serial number is displayed 6 3 6 2 Displaying Instrument Statistics Use You can display the following R S FS300 statistics MODEL model...

Page 177: ...elp the service personnel to analyze the instrument and handle errors and should therefore only be deleted by them Displaying system messages 1 Press the function key in the menu A table listing the c...

Page 178: ...played 2 Select the first line with the 5 or 6 cursor key 7 3 Press the ENTER key 5 The field for the input of the password is displayed 4 Enter the right password and confirm with the ENTER key 5 The...

Page 179: ...urements between the R S FS300 and the PC Permanent analysis of ongoing sweeps to the PC with evaluation ca pabilities Marker Zoom etc Practically unlimited memory capacity for storing traces and meas...

Page 180: ...S300 is installed The R S FS300 must not be connected at this time Secondly the drivers are installed at this time the instrument has to be connected 7 2 1 1 Installing the Program NOTE The Back butto...

Page 181: ...Operating manual 02 2006 7 181 E 1007 9900 15 2 Click Next to continue the installation 3 Click Browse to assign a new directory if you wish to install the pro gram in another directory than proposed...

Page 182: ...0 15 7 182 Operating manual 02 2006 4 Click Next to continue the installation Installation begins and the data are transferred to the PC Please wait a moment 5 Click Finish to successfully complete th...

Page 183: ...ted to the PC via the USB interface The connection cable has two plug types Plug A is connected to the computer computer manual and plug B is connected to the R S FS300 2 41 The FS300 USB drivers will...

Page 184: ...ation R S FS300 E 1007 9900 15 7 184 Operating manual 02 2006 Installing device drivers 3 Click Next to continue the installation 4 Select Search for a suitable driver for my device and click Next to...

Page 185: ...might occur if you have installed different driver versions used different installation sources or installed also the VXI PnP drivers on your system 6 Click OK to continue the installation Depending...

Page 186: ...vice driver for the Rohde Schwarz Power Supply Windows generally remembers all the nec essary information when installing the Spectrum Analyzer R S FS300 and installs the Rohde Schwarz Power Supply wi...

Page 187: ...C R S FS300 is connected to the PC via the USB interface The connection cable has two plug types Plug A is connected to the computer computer manual and plug B is connected to the R S FS300 2 41 The F...

Page 188: ...188 Operating manual 02 2006 If the R S FS300 is not automatically recognized check that the USB master switch of the R S FS300 is at AUTO 6 169 Installing device drivers 3 Select Install the software...

Page 189: ...might occur if you have installed different driver versions used different installation sources or installed also the VXI PnP drivers on your system 5 Click OK to continue the installation Depending...

Page 190: ...vice driver for the Rohde Schwarz Power Supply Windows generally remembers all the nec essary information when installing the Spectrum Analyzer R S FS300 and installs the Rohde Schwarz Power Supply wi...

Page 191: ...ion and Configuration Operating manual 02 2006 7 191 E 1007 9900 15 The drivers are now correctly installed and this can be checked using the device manager 7 Create now the program version for specif...

Page 192: ...e provided Series 300 Software Manager is explained in the following section Before this process can be started the R S FS300 K1 Software needs to be installed on your PC 7 180 and one or more instrum...

Page 193: ...Click Create Program A program version for specific instrument is created and displayed in II with the status D The program number is created from the instrument name FS300 and the serial number 0000...

Page 194: ...rive The autorun function automatically initiates installation Alternatively you may also initiate the installation in the start menu of Windows Start Run using the Setup exe from the CD The uninstall...

Page 195: ...dy existing to the listed instruments have to be updated manually Starting the service program 1 Start the Series 300 Software Manager 7 192 The service program initializes and the window Authorizatio...

Page 196: ...ent for which you wish to update a link Updating the link 4 Click in II on Update to update the displayed link 5 Click in II on Exit to shut down the service program The updated connection FS300 0000x...

Page 197: ...300 2 41 Prepare remote con trol 1 Switch on the R S FS300 and the computer Connect instrument to PC 2 Connect the instrument to the computer with the USB cable The com puter recognizes the attached i...

Page 198: ...tart Programs Rohde Schwarz Series300 FS300 0000xxxxxx If the link is not avail able 2 If the program does not start then click with the right mouse button in the Windows start up directory on Start P...

Page 199: ...opens automatically when you start the program The current R S FS300 settings are loaded The following settings are display and evaluation functions and are not transferred to the PC software Marker...

Page 200: ...1 Measuring Task ATTENTION The input stage of the R S FS300 can be destroyed by overloads or DC components If there is a possibility that the limits specified in the data sheet may be violated the in...

Page 201: ...frequency with the built in frequency counter Resetting the R S FS300 1 Start the PC software FS300 0000123456 EXE on your PC Alternatively you may also open a new session when the PC software is alre...

Page 202: ...he marker 8 You can change the position of the marker by moving the arrow with the left Mouse Button The parameter field above shows the marker val ues M1 Measuring the fre quency with the built in fr...

Page 203: ...rovides continuous information about the results and pa rameters of the selected measuring functions The display format for the measuring results and the insertion of the function displays depend on t...

Page 204: ...displayed in the parameter field RBW current resolution bandwidth LN for max sensitivity VBW current video bandwidth SWT current sweep time M1 marker 1 with marker position and level value M2 marker...

Page 205: ...s can be accessed in the menu area In addition Windows typical menu items can be called up via a toolbar icons Menus for setting the measuring parameters and functions are also available as a toolbar...

Page 206: ...ency display span Span Reference level Level Sweep time SWT Resolution band width RBW These may be changed at any time Inserting specific functions In the lower part of the function display different...

Page 207: ...b Space bar Space Mouse buttons left right 7 5 2 1 Numeric Keys Function The numeric keys are used to enter numerical parameters 0 9 At cursor insert numbers 0 9 At cursor insert decimal separating si...

Page 208: ...2 3 Function Keys Function Function keys open the menus to set the measuring parameters and measur ing functions and insert the corresponding function display F5 Inserts the Frequency function displa...

Page 209: ...splay Tab key Jumps from one control element to another in a function display etc NOTE The tab key can be only used to make selections when an input field a selection field or a control button has bee...

Page 210: ...the mouse The contents of input fields can be highlighted with mouse button pressed and held The cursor can be positioned in the input fields by clicking the mouse button Selection fields can be opene...

Page 211: ...to select a menu 7 207 Instrument parameters and program functions can be selected in different ways on the PC interface e g unit for the level display Selecting with the pull down menu Selecting with...

Page 212: ...ing markers The keyboard and mouse can be used for the settings 7 207 7 5 4 1 Direct Selection of a Instrument Function Various methods are possible Some instrument functions are executed immediately...

Page 213: ...eters Setting instrument functions in the in put window Two methods are available for entering the numerical parameters e g input ting the frequency display range Inputting a value with numeric keys I...

Page 214: ...tting using the arrow keys can be done in a number of different ways Selecting a decimal point and incrementation or decrementation with the 6 5 arrow keys on the keyboard 4 x 6 Incrementing or decrem...

Page 215: ...g the arrow with the left mouse button The marker values can be read in the parameter fields above 7 6 Overview of all Menus and Functions Shortcuts 7 6 1 File Menus to prepare for a Session The follo...

Page 216: ...spectrum analyzer are displayed in the pull down menu Functions or in the toolbar menu The order of the menus mirrors that of the procedure for configuring and starting measurements Selecting the fre...

Page 217: ...ubmenu Entering the step width of the center frequency Setting the step size manually 5 Setting the step size automatically 9 Setting the step size to the center frequency Setting the step size to the...

Page 218: ...ible Function display insert with F6 key Function and shortcut Entering the reference level 1 Entering a level offset 2 Selecting the level display range 3 Selecting a unit for the level display 4 Set...

Page 219: ...ure signal frequency Set resolution 12 De activate marker 1 6 Open submenu Activate marker 2 Place marker 2 on the trace maximum 5 Place marker 2 on the next trace maximum to the left 7 Place marker 2...

Page 220: ...up on screen 14 Bring limit line up on screen 7 228 Open submenu Reference points for measuring level differences Activating the entry of arbitrary reference points 1 Using M1 marker values as a refe...

Page 221: ...deo bandwidth setting 10 Open submenu Setting the RBW VBW coupling ratio Setting the coupling ratio manually 4 Activating the default setting for the coupling ratio 11 Open submenu Setting the sweep t...

Page 222: ...race Turning on and activating Trace 1 1 Turning on and activating Trace 2 8 Trace display mode Overwrite mode 2 Trace display mode Max hold 3 Trace display mode Min hold 9 Trace display mode Averagin...

Page 223: ...ring on negative going edge 5 Triggering by the display level 3 6 Entering a trigger offset 4 NOTE The trigger function LINE triggering by the AC line frequency is not sup ported 7 6 2 7 Measure Menu...

Page 224: ...function and displaying the program information are available in the pull down menu Help Start help function 7 239 Display program information 7 239 7 6 5 Zoom Functions Diagram area always visible F...

Page 225: ...ferred to the PC software Marker functions 7 219 Scale of measuring diagram Range Unit Trace functions 7 222 Measure functions 7 223 However you may also open a new session while in remote control mod...

Page 226: ...300 K1 exe icon while the program is closed the program will open using the settings from this fs file Beginning the measurement with saved instrument settings 1 Select menu item Open 2 Select a file...

Page 227: ...save specific instrument settings if you plan to work with them on a regular basis Save Session You may also change a previously saved instrument setting and save it under a different file name Save...

Page 228: ...Lines Application Measuring values which overshoot the limit lines are monitored with an Up per Line and measuring values which undershoot the limit lines are moni tored with a Lower Line The shape o...

Page 229: ...row in the table describes a reference point on the limit line At least 2 value pairs reference points per line must be entered e g lower line 80 dB for full span NOTE You may increase and decrease th...

Page 230: ...loading limit lines 1 Press SAVE if you plan to use the current settings again The Save File as window opens 2 Select a directory enter a file name and click Save The current set tings are saved 3 Pre...

Page 231: ...and undershooting of a limit line This allows random events to be captured Creating the logfile 1 Select menu item Logfile The Logfile window opens 2 Click change if a logfile has not yet been created...

Page 232: ...toring process The button lights up red If an over or undershoot of a limit is detected the corresponding status information Upp and or Low flashes in the diagram The measuring val ues are monitored 1...

Page 233: ...when a limit line has been over or undershot Date event date Time event time MinLimit 1 limit line level Upp MaxLimit limit line level Low EventFreq 2 event frequency value EventLevel 3 event maximum...

Page 234: ...he most important parameter settings in ASCII code or you can save a screen shot of the current window as a JPEG 7 7 4 1 Creating the ASCII File Creating the ASCII file 1 Select menu item ASCII file T...

Page 235: ...n RBW resolution bandwidth Pixel level values of the trace NOTE The number of exported level values pixels depends on the setting for the size of the window 7 237 small window 310 pixels large window...

Page 236: ...nd page number 3 Check Use default margins from preferences to print page with the presettings You may also check Custom margins to print page with user defined settings You may then adjust the page m...

Page 237: ...item Large Window to enlarge the program window The diagram is enlarged by a factor of 2 In addition to the Main Set tings two function displays appear in the function display area The first function...

Page 238: ...nts can be changed 2 Click on a color field to change the color for the corresponding windows element A color scheme opens 3 Move the mouse over the color bars and click on your preferred color The co...

Page 239: ...Acrobat Reader CD ROM starts up and the English R S FS300 operating manual opens 7 9 2 Displaying the Program Version Opening closing the program version 1 Select menu item Info for information about...

Page 240: ...btain information about the individual modules The modules of the R S FS300 will be output and displayed Starting self diagnostics 2 Click the line FS300 to select the generator module 3 Click Self te...

Page 241: ...he front of this manual 8 1 Keyboard Connector KEYB Connector There is a 6 pin PS 2 connector KEYBOARD 21 on the R S FS300 s rear panel for an external keyboard Pin Signal 1 KEYBOARDDATA 2 MOUSEDATA 3...

Page 242: ...N and REF OUT External reference If an external reference is used the internal reference oscillator is synchro nized to the 10 MHz reference signal at connector REF IN 22 The input level must be 0 5 t...

Page 243: ...ording to the following steps Device Error Error number A system error was detected in the instrument 1 Please write down the error number and the corresponding instrument settings 2 Contact your near...

Page 244: ...94 NOTE This display will appear even if the signal is outside the currently se lected span In FULL SPAN mode 6 82 check whether a signal exceeds the permissible value and reduce the level if necessa...

Page 245: ...6 129 Create Program 7 192 Cursor keys Description 5 51 Parameter entry 5 62 D Date 6 166 Default setting Coupling RBW SPAN 6 126 Default settings Coupling 6 95 6 125 Instrument 6 74 Device Drivers W...

Page 246: ...1 7 204 7 215 Markers Center frequency 6 106 Display 5 54 Frequency measurements 6 101 Level differences 6 104 Maximum 6 99 6 103 Noise power density 6 110 Signal bandwidth 6 111 Step size 6 108 Trace...

Page 247: ...ZERO SPAN 6 146 Noise power density 6 110 Power on cycles 6 176 Preset 6 153 Print Window screenshot 7 236 Program Control 7 203 Create 7 192 Exit 7 200 Install 7 180 Start 7 198 Uninstall 7 194 upda...

Page 248: ...intercept point 6 150 Time 6 166 Time axis 6 83 Time domain ZERO SPAN Power measurement 6 146 Switchover 6 83 TOI 6 150 Trace See Trace Averaging 6 134 Difference function 6 137 Math 6 137 Max Hold 6...

Reviews: