Chapter 7: DXi4000 Status
Performance
122
Quantum DXi4000 User’s Guide
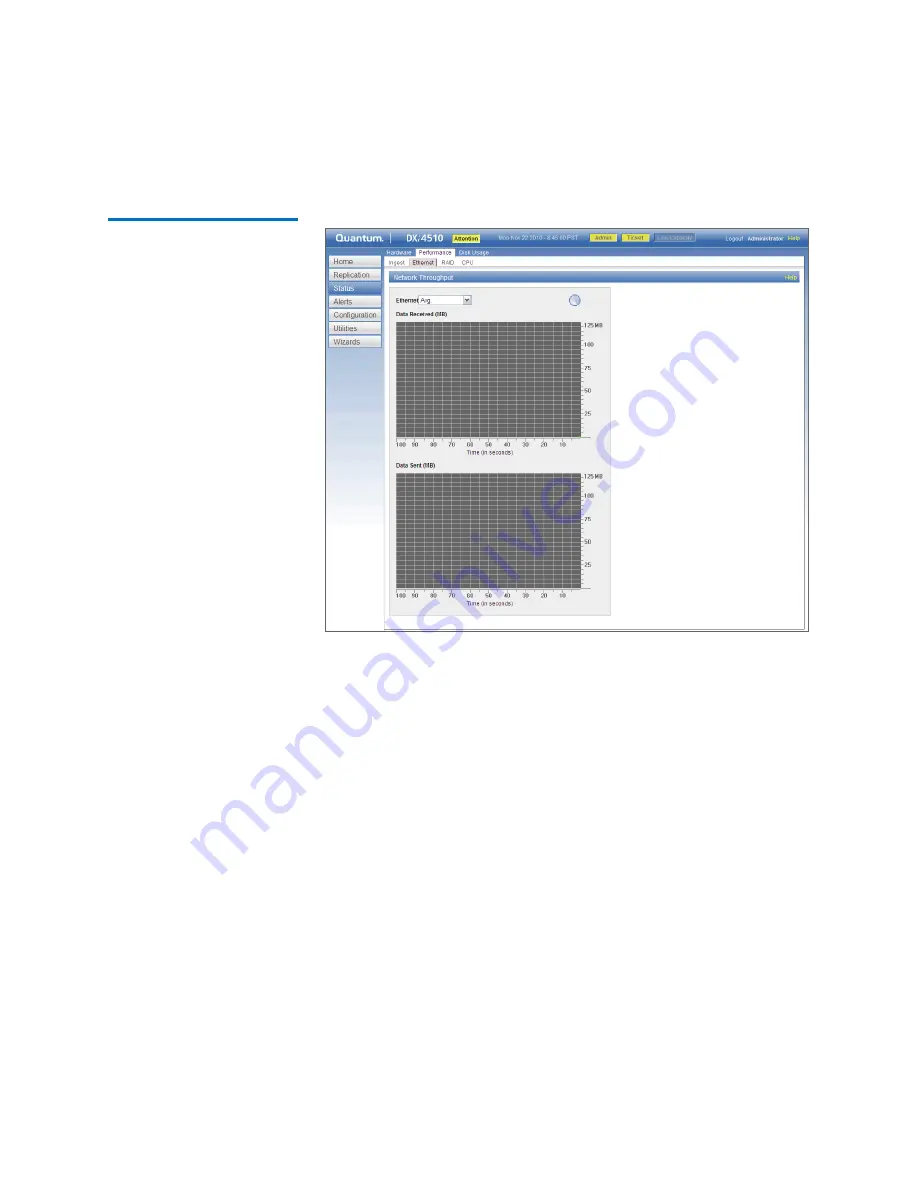
Figure 68 Ethernet Page
Use the
Ethernet
page to display recent network activity in dynamic
graphs:
• The top graph reports data received and the bottom graph reports
data sent.
• Select the port to monitor in the
Ethernet
drop-down box, or select
Avg
to display an average of all ports.
• The horizontal axis displays time (0–100 seconds).
• The vertical axis displays data throughput (0–125 MB/s).
• Values that exceed the maximum value of the vertical axis are
shown in lighter green.
• Each bar on the graph represents approximately 1 second of time.
• Hold the cursor over a bar to display the value of the bar.
Summary of Contents for DXi4510
Page 1: ...User s Guide Quantum DXi4000 6 67092 03 Rev A...
Page 16: ...Tables xvi Quantum DXi4000 User s Guide...
Page 24: ...Preface xxiv Quantum DXi4000 User s Guide...
Page 42: ...Chapter 1 DXi4000 System Description Network Segmentation 18 Quantum DXi4000 User s Guide...
Page 52: ...Chapter 2 Basic Operations Locating Serial Numbers 28 Quantum DXi4000 User s Guide...
Page 272: ...Chapter 10 DXi4000 Utilities Reboot Shutdown 248 Quantum DXi4000 User s Guide...
Page 288: ...Appendix B Troubleshooting Common Problems and Solutions 264 Quantum DXi4000 User s Guide...


