background image

3.2.2  Flare meter validation

Ultrasonic flare flow meters are widely used in refineries 

and petrochemical plants for flare operation and emission 

control. Regulatory compliance requires these flare flow 

meters to be validated periodically to meet their expected 

performance per the manufacturer’s specifications. 

Currently, this typically requires a service engineer to 

travel to the meter installation site, conduct a visual  

and/or physical inspection of the meter hardware and 

components, access the electronics and/or transducers 

to collect performance/diagnostic data for a prescribed 

period, and generate a pass/fail evaluation report  

for the meter after performing certain tests and  

reviewing the data.
A key new feature of the flare.IQ Gen 2 is digital  

verification, a new software as a service offering to  

realize this periodic meter validation in situ. This feature 

obviates the logistical complications of a service visit  

and plant/process interruption that may be required to 

access the meter. This feature has been implemented  

by building in the intelligence required to conduct  

digital verification of a flare meter in situ without  

human intervention into the flare.IQ Gen 2 system. The 

flare meter verification algorithm relies on a “reference” 

measurement of the vent gas composition which  

could be done with an online analyzer such as a gas 

chromatograph or mass spectrometer where available.  

It also uses as input the flare pressure and temperature,  

flow meter data and diagnostics. The overall logic of  

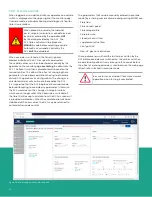
the flow meter validation scheme is shown in figure 9.
The main objective of the digital validation is to verify that 

the flare meter is functioning as designed without having to 

physically access its hardware. Since the flare monitoring 

application is inherently noisy and variable, flow validation 

requires a stable flare process, which usually happens when 

there is no/low flaring event. In this case, vent gas flow rate 

is normally low, and flare gas compositions are relatively 

simple and constant.
The high-level logic for the GF meter performance validation 

is illustrated in figure 10. flare.IQ uses a FIFO buffer to track 

meter performance and diagnostics data over the last  

8 hours. If an on-demand validation is initiated by the  

end user, flare.IQ will analyze the last 8-hour data and  

report a result as one of the following –

a.  Pass
b.  Fail
c.  Process unstable for validation

If the validation is initiated on a pre-determined schedule, 

this validation will operate on an automated fashion on 

the last batch of 8-hour data available. At the end of each 

digital verification cycle, a summary meter validation report 

and the raw data (over the entire 8-hour block) used for 

generating the report are saved in CSV format.

When enough data (8 hours) 

is available for test

Validation initiated by an

“on demand’ button on UI or 

by  a programmable timer

(1st day of each month)

Report out:

Process not stable 

for validation

Report out:

fail (contact 

Panametrics 

service)

Perform diagnostics 

validation

Perform sound 

speed validation

Both validations 

passed?

Perform 

stability test

Report out:

pass

Fail

Pass

Pass/fail

Pass/fail

Yes

AND

No

Figure 10: Flare flow meter validation logic

Online 

flare gas 

analyzer

Flare.IQ with 

validation 

algorithm

Pass/fail/process 

unstable for 

validation

Modbus TCP

Sound speed, channel 

velocities, diagnostics

Customer 

DCS

Ultrasonic flare 

flow meter

Pressure 

+ temp

Figure 9: Digital flare flow meter validation scheme

16

Summary of Contents for flare.IQ Generation 2

Page 1: ...flare IQ Generation 2 Operation and maintenance manual...

Page 2: ...2...

Page 3: ...flare IQ Generation 2 Operation and maintenance manual 910 350 rev A June 2020 3...

Page 4: ...no content intended for this page 4...

Page 5: ...website at the following link https www bakerhughesds com sales terms conditions Typographical conventions Note These paragraphs provide information that provides a deeper understanding of the situati...

Page 6: ...operation Make sure that unauthorized personnel cannot gain access to the operation of the equipment Environmental compliance RoHS The flare IQ fully complies with RoHS regulations directive 2011 65 E...

Page 7: ...rk switch 14 2 3 1 Functional description 14 Chapter 3 Software 15 3 1 Overall architecture 15 3 2 Functional description 15 3 2 1 Flare control 15 3 2 2 Flare meter validation 16 3 3 Configuration 17...

Page 8: ...ion 40 4 3 2 Module installation 40 4 4 Replacing a DPU 41 4 4 1 Installation 41 4 5 Environment 41 4 5 1 Mounting location 41 4 6 Spare parts list 41 4 7 Reliability 41 4 8 Technical regulations and...

Page 9: ...etrics ultrasonic flow meter to calculate the molecular weight of the flare gas and from the molecular weight the net heating value NHV is determined Supplemental fuel gas demand and steam air demand...

Page 10: ...ustomer site has two flare stacks that need to be controlled one power distribution and network top module and a bottom module with four 4 DPUs installed would be required The power distribution and n...

Page 11: ...r connections and power supplies are accessible from the backside of the rack mount panel as shown in figure 3 The end user brings in a non detachable power cord per the detailed specifications provid...

Page 12: ...guration universal power supply adjusts automatically from 100 to 240 VAC 50 60 Hz Max power consumption 45 W DC configuration not available Size dimensions Top module 19 02 483 mm width x 6 93 176 mm...

Page 13: ...before powering on the system The power connector must then be reconnected Table Power connector pin assignments Pin Signal Description 1 Power IN V 10 30 V DC 2 Power IN V GND Figure 7 Phoenix conta...

Page 14: ...e PE connection on the AC input terminal The power supply unit is electrically connected to the mounting DIN rail via the mounting rail adapter PE connection via the terminal point is not required if...

Page 15: ...Functional description 3 2 1 Flare control The flare control software algorithm uses the speed of sound measured by Panametrics ultrasonic flare flow meter to estimate the molecular weight of the vent...

Page 16: ...fy that the flare meter is functioning as designed without having to physically access its hardware Since the flare monitoring application is inherently noisy and variable flow validation requires a s...

Page 17: ...web console can be launched from a supported web browser running on a host PC connected to the configure monitor ethernet 1 switch on the top module From your web browser enter ip address fiqWeb to la...

Page 18: ...cessfully uploaded all menu items on the left side of the web console application will turn blue live on the features page and the validity of each license will be indicated by showing the number of d...

Page 19: ...he monitor page and may change their own password on the accounts page Figure 14 shows how new users can be added by creating new accounts for them along with the username and password requirements Du...

Page 20: ...dards Word order most significant word MSW first is the default Please note that word order is not formally defined by the Modbus standards A detailed description of the Modbus map required to set up...

Page 21: ...pes of flare installations available on the left side of flare configuration page are Flare name Flare tip diameter Flare to steam ratio correction factor Flare flowmeter diameter Choice of flare assi...

Page 22: ...his figure also shows as a representative example the state of the web console prior to clicking either CANCEL or SAVE and CONTINUE at the bottom One of these must be clicked for any of the other tabs...

Page 23: ...iew is displayed This screen provides a real time readout of essential data being sent to the flare IQ and the results the flare IQ has calculated Displayed data is organized in panes as follows The h...

Page 24: ...not been recalculated or is the result of a calculation using another parameter that has not been updated by the DCS in a specified time period Most parameters are considered stale if they have not be...

Page 25: ...Figure 22 Monitor page with no Modbus connection Figure 23 Monitor page with active Modbus connection Figure 24 Monitor page under timeout conditions 25...

Page 26: ...es in calculated values will continue to be read by the DCS It is imperative that the DCS be placed in manual mode before attempting to override any parameter Otherwise the DCS would act on the change...

Page 27: ...ion file via the service page As shown in figure 10 running digital verification requires a minimum amount of meter diagnostic data collected over an 8 hour time window This ensures verification occur...

Page 28: ...able to identify an adequately long block of stable data In this case the verification procedure can be repeated after waiting for a minimum of 30 minutes In either case you are advised to save both...

Page 29: ...broken the signal value is unchanging or the signal is out of range In these cases the signal value is held at the last known good value Additionally the flare IQ will validate that inputs are reasona...

Page 30: ...or GC_UPDATE_RATE 1090 2 Expected time between GC MS updates seconds MW_LOW 1100 2 Low molecular weight to apply correction factor MW_NORM 1102 2 Normal molecular weight to apply correction factor MW_...

Page 31: ...m flare meter SIG_STRENGTH_CH1_UP 2106 2 Ch 1 upstream signal strength from flare meter SIG_STRENGTH_CH1_DN 2108 2 Ch 1 downstream signal strength from flare meter SIG_QUALITY_CH1_UP 2110 2 Ch 1 upstr...

Page 32: ...ter AMPLITUDE_CH2_DN 2216 2 Ch 2 downstream amplitude from flare meter PEAKNUM_CH2_UP 2218 2 Ch 2 upstream peak number from flare meter PEAKNUM_CH2_DN 2220 2 Ch 2 downstream peak number from flare met...

Page 33: ...rived from mol weight NHVCZ_MEASURED_TC 416 2 Net heating value in the combustion zone at current fuel and steam NHVCZ_UNCORRECTED_TC 418 2 NHVcz uncorrected for H2 at current fuel and steam NHVCZ_UNC...

Page 34: ...NPUT_BQ 14 1 NHV vent gas from GC MS value bad Status register RESERVED_15 15 1 Reserved returns 0 Status register RESERVED_16 16 1 Reserved returns 0 Status register QFUEL_BQ 17 1 Fuel gas flow measu...

Page 35: ...us register RESERVED_48 48 1 Reserved returns 0 Status register RESERVED_49 49 1 Reserved returns 0 Status register RESERVED_50 50 1 Reserved returns 0 Status register RESERVED_51 51 1 Reserved return...

Page 36: ...Volumetric flow of n2 Sm3 h SCFH Flowmeter flare diameter in in FUEL PAGE Fuel net heating value MJ m3 BTU SCF Update rate Seconds Seconds Fuel min Sm3 h SCFH Fuel max Sm3 h SCFH Monitor page Net hea...

Page 37: ...ations of EN 60950 It must be possible to switch off the device using a suitable disconnecting device outside the power supply Note that an all pole disconnecting device must be provided for 2 phase o...

Page 38: ...Figure 30 System wiring diagram 38...

Page 39: ...on and monitoring via the fiqWeb application described in Section 3 3 LAN A and the other dedicated to Modbus TCP for exclusive use by the plant DCS LAN B Any available Ethernet port on the top switch...

Page 40: ...es will have 2 modules 1 top power distribution and networking module with two independent network switches and 1 bottom DPU module with 6 DPUs The top module must be installed right above the bottom...

Page 41: ...th at least an IP52 rating protection from high voltage or high current devices or devices which produce electromagnetic interference avoidance of vibration selection of a location that will provide a...

Page 42: ...onnected to each other Both LAN A and LAN B support internet control message protocol ICMP or ping echo request and reply messages As described in section 3 3 2 above DHCP is not supported Static IP a...

Page 43: ...r flare control Register tag name Register address Number of registers Description Scaling factor AR 10 1 Argon concentration fraction 0 0 to 1 0 10 CO2 11 1 Carbon dioxide concentration fraction 0 0...

Page 44: ..._LOW 110 1 Low molecular weight to apply correction factor 100 MW_NORM 111 1 Normal molecular weight to apply correction factor 100 MW_HIGH 112 1 High molecular weight to apply correction factor 100 Q...

Page 45: ...ne derived from mol weight BTU SCF 1 NHVCZ_MEASURED_TC 8 1 Net heating value in the combustion zone at current fuel and steam BTU SCF 1 NHVCZ_UNCORRECTED_TC 9 1 NHVcz uncorrected for H2 at current fue...

Page 46: ...L_DEMAND is a value read from the flare IQ containing the amount of supplemental fuel in standard cubic feet per hour SCFH required for compliance It is expressed in the Modbus address list as Cmd add...

Page 47: ...g Inches of water gauge MACT Maximum Achievable Control Technology EPA standard Mbps Megabits per second MBps Megabytes per second MJ m3 Megajoules per cubic meter m s Meters per second m3 s Cubic met...

Page 48: ...48...

Page 49: ...no content intended for this page 49...

Page 50: ...bon reduction targets across critical industries including Oil Gas Energy Healthcare Water and Wastewater Chemical Processing Food Beverage and many others Join the conversation and follow us on Linke...

Reviews: