Chapter 2. Displaying Data
4
DigitalFlow™ XMT868i Programming Manual
2.3.1
Displaying Data on a Computer Terminal (cont.)
Proceed directly to the appropriate section for instructions on either of the following output options:
•
Text Display
output, discussed below
•
Graphing
output on page 6
Note:
For information on the
Logging
output, see Chapter 3,
Logging Data.
2.3.2 The Text Display Output
To collect data from the instrument and display it on a text screen, complete the following steps:
1.
Complete Steps 1-3 on the previous page.
2.
Pull down the
Output
menu and click on the
Text Display
option (see Figure 2 on page 3).
Note:
The
Text Display
window that appears after Step 2 is actually stacked on top of any previously opened
windows (such as the
Meter Browser
window).
3.
Using the
Window
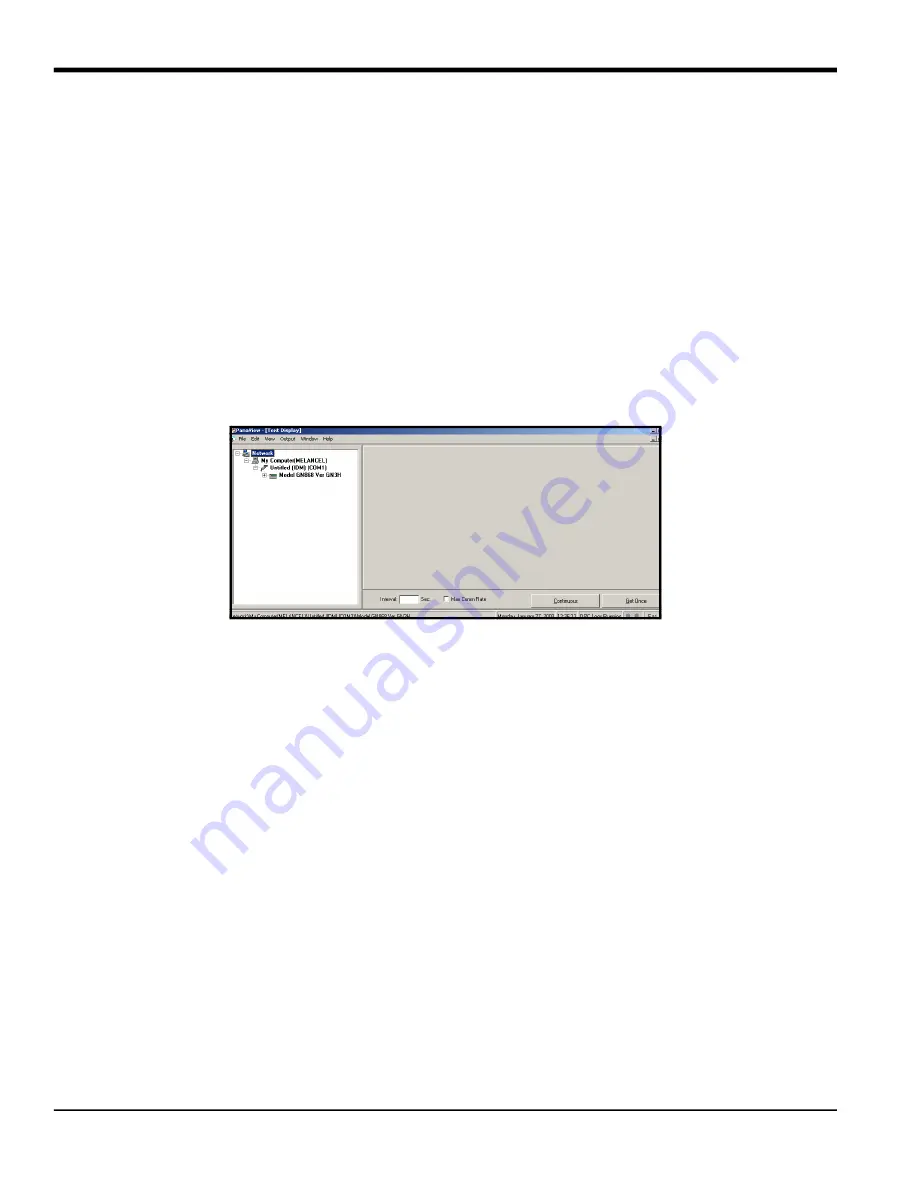
menu, arrange the open windows in the desired format. For this discussion, Figure 3 shows the
Text Display
window in its maximized (full-screen) size.
Figure 3: Text Display Window
Note:
Figure 3 has been compressed both vertically and horizontally for improved clarity.
4.
The left pane of the
Text Display
window contains the standard PanaView network tree. Expand this tree as far as
necessary, and double click on the desired process parameter to display it in the right pane of the window.
5.
Before actual data values can be displayed in the text pane, activate one of the following data collection modes
(see Figure 3 on page 4):
• Click on the
[Get Once]
option button at the bottom of the right pane in the
Text Display
window. The current
value of the selected process parameter, as specified in the PanaView network tree, is displayed in the right
pane of the
Text Display
window, or
• Enter an
interval
in the text box at the bottom of the right pane in the
Text Display
window, or check the
Max.
Comm Rate
box to collect readings as fast as the system allows (1 sec). Then, click on the
[Continuous]
option
button to begin collecting data for display in the right pane of the
Text Display
window.
Note:
Any value entered in the
Interval
text box is overridden if the
Max. Comm Rate
box is checked.
6.
If the
[Continuous]
option was selected in Step 5 above, click on the
[Stop]
option button, which has replaced
the original
[Continuous]
option button, to terminate data collection.
The
Text Display
window may be left open while other tasks are performed, or it may be closed by clicking on the
lower
[X]
control button at the far right of the menu bar.
IMPORTANT:
If you click on the upper
[X]
control button at the far right of the PanaView title bar, you will exit
PanaView completely.
2.3.2.1
Displaying Multiple Process Parameters
The procedure for displaying a single process parameter in a text screen may be repeated to simultaneously display
multiple process parameters. To do so, proceed as follows:
Summary of Contents for DigitalFlow XMT868i
Page 2: ......
Page 4: ...ii no content intended for this page...
Page 50: ...Chapter 1 Programming Site Data 42 DigitalFlow XMT868i Programming Manual...
Page 74: ...Chapter 4 Printing Data 2 DigitalFlow XMT868i Programming Manual...
Page 78: ...Chapter 5 Clearing Data 4 DigitalFlow XMT868i Programming Manual...
Page 79: ...DigitalFlow XMT868i Programming Manual 5 Appendix A Menu Maps Appendix A Menu Maps...
Page 80: ...Appendix A Menu Maps 6 DigitalFlow XMT868i Programming Manual...
Page 86: ...Appendix A Menu Maps DigitalFlow XMT868i Programming Manual...
Page 144: ...Appendix D PanaView Menu Maps for the XMT868i 70 DigitalFlow XMT868i Programming Manual...
Page 150: ...Appendix A PanaView Menu Maps DigitalFlow XMT868i Programming Manual 76...
Page 162: ...Warranty 6 AquaTrans AT868 User s Manual no content intended for this page...
Page 163: ......


