©2016 PACE Inc., Vass, North Carolina,
All Rights Reserved
Page
7
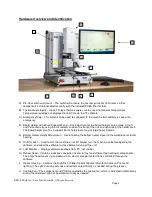
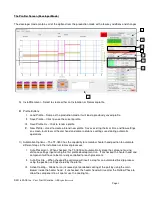
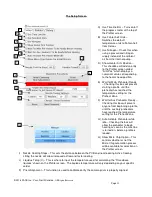
M) Sensors – The current and peak temperatures for any attached K-type thermocouples will be shown in
real time during a profile run. Also displays how long the thermocouple has spent above the
temperature for the solder being used to be completely liquid.
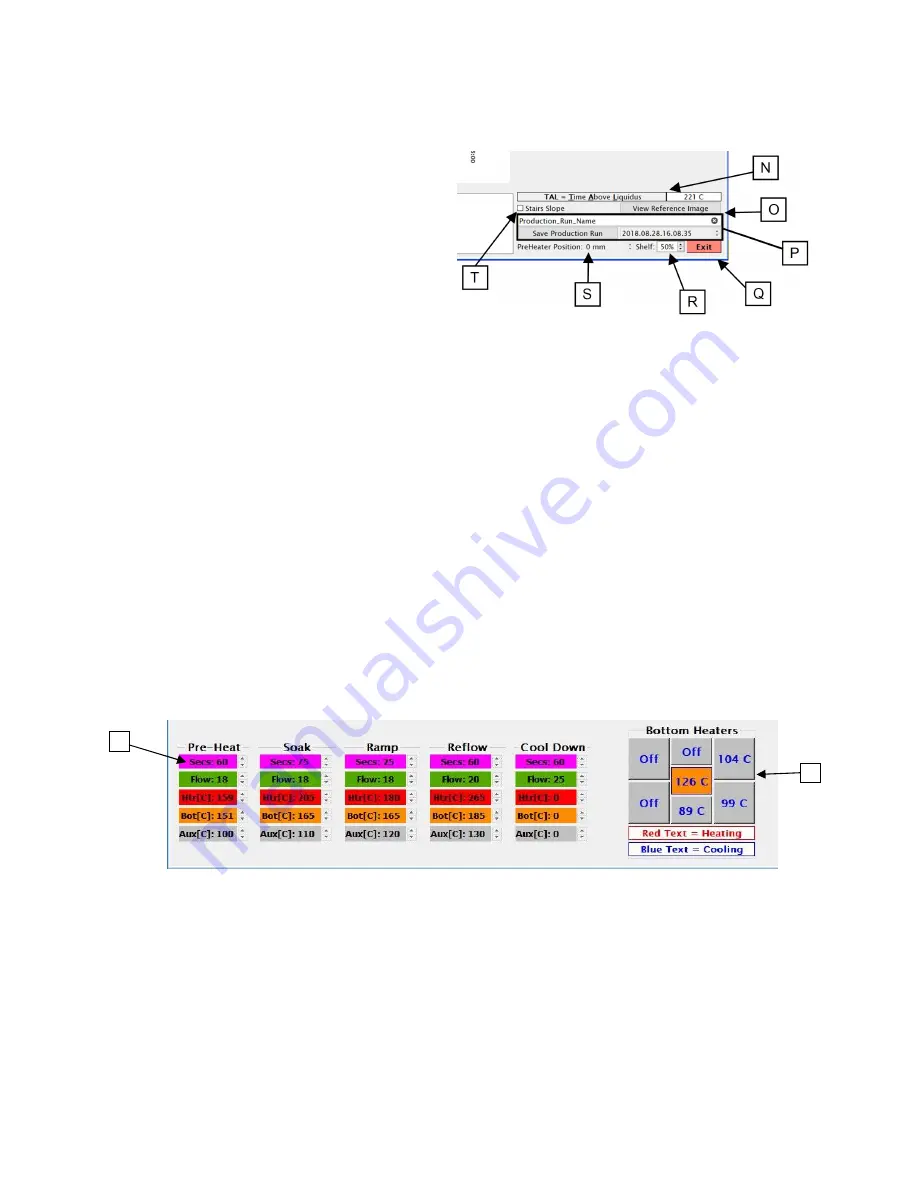
N) Time Above Liquidus – Reference to the
liquidus temperature set in the current
thermal profile.
O) View Reference Image – Used to view the
reference image associated to the current
profile, if one was added during development.
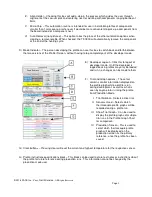
P) Save Production Run – For saving
temperature graphs and other information
from a production run in a .PDF for later
reference. If “Log Sensor Data” is checked, saving the production run will also create a time-tagged
CSV file including information thermocouple data and heater commands. The file will be named with text
input to the block shown here as “Production_Run_Name” and a time stamp.
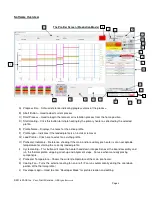
Q) Exit – Exits the TF software.
R) Shelf – Used to change brightness of the under-shelf lighting illuminating the back of the board holder.
S) Preheater Position – Indicates what height to set the preheater for the currently loaded profile.
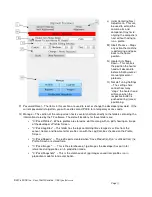
T) Stairs Slope – Controls the temperature slope measurement in the profile graph. Selecting two points
on the same temperature curve will display the temperature over time (or slope) for that portion of the
curve. When Stairs Slope is checked, selecting a point outside of an existing slope measurement will
create a new measurement from the nearest end of the existing slope. When Stairs Slope is not
engaged, selecting a point outside of an existing slope will lengthen the slope measurement to that point
of the temperature curve.
U) Comments – This block can be used by the operator to enter information about the production run to the
file created by the Save Production Run feature.
V) Instructions – This block will display any information left by the developer for the currently loaded profile.
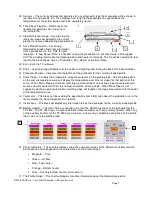
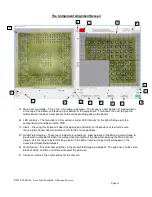
W) Bottom Heaters – The icons here are used to turn on/off the different sections of the preheater for the
TF-2800. The TF-1800 uses a single unified pre-heater and does not have auxiliary heaters. When any
of the auxiliary heaters for the TF-2800 are turned on, a new entry is added to each phase of the profile
the as well as to the profile graph.
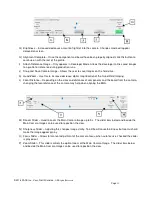
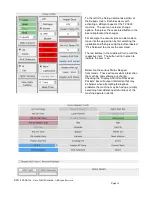
X) Phase Indicators – These colored blocks show the numerical values of the different variables for each
profile phase and correspond to the colored lines on the Profile Graph.
•
Magenta – Time
•
Green – Air flow
•
Red – Top heater
•
Orange – Bottom heater
•
Grey – Auxiliary bottom heaters (if turned on.)
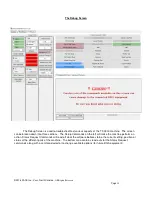
Y) The Profile Graph – This chart will display real-time information about the temperature profile.
W
X


