background image

6.Communication with PC


60 

Using LAN Port   

Connect directly   

(1) 

Connection

. Plug in the LAN line to the LAN port in the rear  panel of the 

oscilloscope; plug the other end into the LAN interface of the computer.   

(2) 

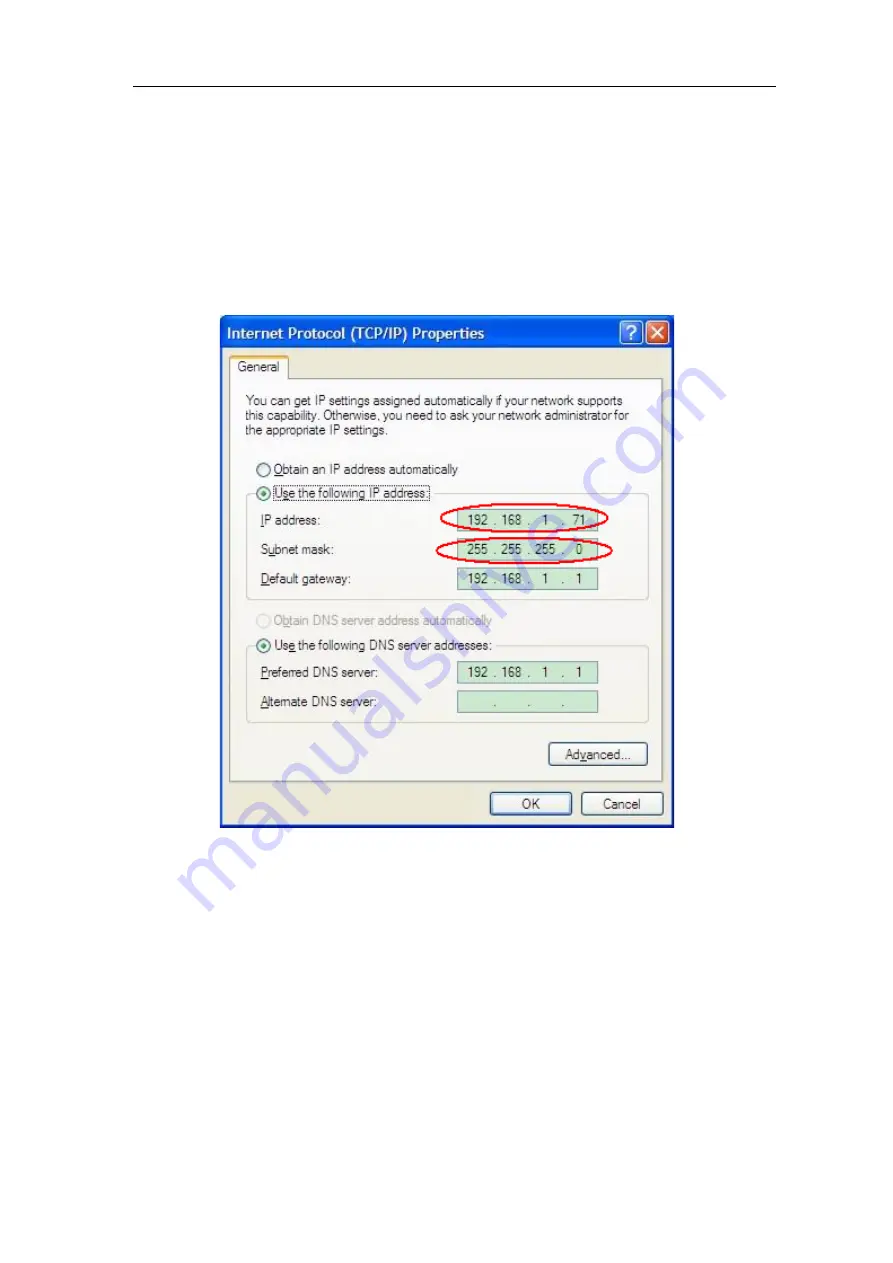
Set the network parameters of the computer

. Since the oscilloscope cannot support 

obtaining an IP address automatically, you should assign a static IP address. Here we 
set the IP address to 192.168.1.71.   


Figure 6-2 Set the network parameters of the computer 

(3) 

Set the network parameters of the Software. 

Run the software on the computer; 

choose the "Ports-settings" of the "Communications" menu item. Set "Connect using" 
to LAN. About the IP, the first three bytes is same as the IP in the step (2), the last 
byte should be different. Here, we set it to 192.168.1.72. The range of the port value is 
0

65535, but the port which under 2000 is always be used, so it is suggested to set it 

to the value above 2000. Here, we set it to 3000. 


Summary of Contents for tds series

Page 1: ......

Page 2: ...However OWON will continue to improve products and reserves the rights to changes specification at any time without notice OWON is the registered trademark of the Lilliput Company Headquarter Fujian Lilliput Optoelectronics Technology Co Ltd The mansion of optoelectronics 19 Heming Road Lantian industrial zone Zhangzhou Fujian China Tel 86 596 2130430 Fax 86 596 2109272 Web www owon com hk Mail Bu...

Page 3: ...e This warranty shall not apply to any defect failure or damage caused by improper use or improper or inadequate maintenance and care Lilliput shall not be obligated to furnish service under this warranty a to repair damage resulting from attempts by personnel other than Lilliput representatives to install repair or service the product b to repair damage resulting from improper use or connection t...

Page 4: ...to the Vertical System 14 Introduction to the Horizontal System 16 Introduction to the Trigger System 16 Introduction to the Touchscreen Controls 17 Set the Vertical System through touchscreen 18 Set the Horizontal System through touchscreen 19 Zoom the Waveform through Touchscreen 19 Operate the Menu through Touchscreen or Buttons Knob 21 5 Advanced User Guidebook 23 How to Set the Vertical Syste...

Page 5: ... How to Measure Automatically 49 How to Measure with Cursors 52 How to Use Autoscale 56 How to Use Executive Buttons 57 6 Communication with PC 59 Using USB Port 59 Using LAN Port 60 Connect directly 60 Connect through a router 61 7 Demonstration 64 Example 1 Measurement a Simple Signal 64 Example 2 Gain of an Amplifier in a Metering Circuit 65 Example 3 Capturing a Single Signal 66 Example 4 Anal...

Page 6: ...ectric shock the grounding conductor must be grounded The product must be grounded properly before any connection with its input or output terminal When powered by AC power it is not allowed to measure AC power source directly because the testing ground and power cord ground conductor are connected together otherwise it will cause short circuit Check all Terminal Ratings To avoid fire or shock haz...

Page 7: ... in damage to this product or other property Terms on the product The following terms may appear on this product Danger It indicates an injury or hazard may immediately happen Warning It indicates an injury or hazard may be accessible potentially Caution It indicates a potential damage to the instrument or other property might occur Safety Symbols Symbols on the product The following symbol may ap...

Page 8: ...nput Oscilloscope Electrical Outlet Probe Power Cord It is not allowed to measure AC power when the AC powered oscilloscope is connected to the AC powered PC through the ports Warning To avoid fire or electrical shock when the oscilloscope input signal connected is more than 42V peak 30Vrms or on circuits of more than 4800VA please take note of below items Only use accessory insulated voltage prob...

Page 9: ...o 2GS s realtime sample rate 7 6M record length Waveform zooming horizontal vertical and saving FFT points length and resolution variable Multi window extension User friendly voice warning 8 inch 800 600 pixels high definition touchscreen Multi communication interface USB VGA LAN ...

Page 10: ...terface How to implement the general inspection How to implement the function inspection How to make a probe compensation How to set the probe attenuation coefficient How to use the probe safely How to implement an auto calibration Introduction to the vertical system Introduction to the horizontal system Introduction to the trigger system Introduction to the Touchscreen Controls ...

Page 11: ...leting some basic operations in which the knobs and function pushbuttons are included The knobs have the functions similar to other oscilloscopes The 5 buttons F1 F5 in the column on the right side of the display screen or in the row under the display screen H1 H5 are menu selection buttons through which you can set the different options for the current menu The other pushbuttons are function butt...

Page 12: ...ds to use this port 2 USB Device port It is used to transfer data when external USB equipment connects to the oscilloscope regarded as slave device For example to use this port when connect PC to the oscilloscope by USB 3 VGA port To connect the oscilloscope with a monitor or a projector as VGA output 4 LAN port the network port which can be used to connect with PC 5 The port of trigger signal out...

Page 13: ...trol time base Horiz key can enable disable the split screen zoom 4 Trigger control area with 3 keys and 1 knob TRIG LEVEL knob is to adjust trigger voltage Other 3 keys refer to trigger system setting 5 Vertical control area with 5 keys and 8 knobs CH1 CH4 keys correspond to setting menu in CH1 CH4 Math key provides access to math waveform functions FFT Four VERTICAL POSITION knob control the ver...

Page 14: ...veform Ready Pre triggered data captured and ready for a trigger Scan Capture and display the waveform continuously Stop Data acquisition stopped 3 T pointer indicates the horizontal position for the trigger 4 The pointer indicates the trigger position in the internal memory 5 Cursors for cursor measurement 6 Present triggering value 7 It indicates that there is a U disk connecting with the oscill...

Page 15: ...e record length 22 It indicates the measured type and value of the corresponding channel The measured type F Freq T Period V Mean Vp PK PK Vk RMS Ma Max Mi Min Vt Vtop Vb Vbase Va Vamp Os Overshoot Ps Preshoot RT Rise Time FT Fall Time PW Width NW Width D Duty D Duty Delay Delay Delay Delay 23 The green pointer indicates the grounding datum point zero point position of the waveform of the CH4 chan...

Page 16: ...ed by the transportation please keep the package With the transportation department or the Lilliput s distributor responsible for this business informed about it a repairing or replacement of the instrument will be arranged by the Lilliput How to Implement the Function Inspection Make a fast function check to verify the normal operation of the instrument according to the following steps 1 Connect ...

Page 17: ...the menu as 10X and that of the switch in the probe as 10X see How to Set the Probe Attenuation Coefficient on P13 and connect the probe with the CH1 channel If a probe hook tip is used ensure that it keeps in close touch with the probe Connect the probe tip with the signal connector of the probe compensator and connect the reference wire clamp with the ground wire connector of the probe connector...

Page 18: ...menu corresponding to the probe This setting will be valid all the time before it is changed again Caution The default attenuation coefficient of the probe on the instrument is preset to 10X Make sure that the set value of the attenuation switch in the probe is the same as the menu selection of the probe attenuation coefficient in the oscilloscope The set values of the probe switch are 1X and 10X ...

Page 19: ...t Self calibration The self calibration application can make the oscilloscope reach the optimum condition rapidly to obtain the most accurate measurement value You can carry out this application program at any time This program must be executed whenever the change of ambient temperature is 5 or over Before performing a self calibration disconnect all probes or wires from the input connector Press ...

Page 20: ...cut key Turn the VERTICAL POSITION knob to change the vertical display position of channel and press the position knob to set the vertical display position back to 0 as a shortcut key this is especially helpful when the trace position is far out of the screen and want it to get back to the screen center immediately 2 Change the Vertical Setting and Observe the Consequent State Information Change W...

Page 21: ...tal position of the signal in the waveform window The HORIZONTAL POSITION knob is used to control the triggering displacement of the signal or for other special applications If it is applied to triggering the displacement it can be observed that the waveform moves horizontally with the knob when you rotate the HORIZONTAL POSITION knob Triggering displacement back to 0 shortcut key Turn the HORIZON...

Page 22: ...layed in the screen changes accordingly PS Turning the TRIG LEVEL knob can change trigger level value and it is also the hotkey to set trigger level back to 0 3 Press the button 50 to set the trigger level as the vertical midpoint values of the amplitude of the trigger signal 4 Press the Force button to force a trigger signal which is mainly applied to the Normal and Single trigger modes Introduct...

Page 23: ...4 buttons Touch the pointer on the left side of corresponding channel to make it in selected state Set the vertical position of the selected channel VERTICAL POSITION knob Unselect the channel window drag your finger up or down across the left half of the screen Set the voltage division of the selected channel vertical VOLTS DIV knob Select the channel window bordered drag your finger up or down a...

Page 24: ...t across the top half of the screen Set the horizontal time base horizontal SEC DIV knob Drag your finger left or right across the bottom half of the screen Zoom the Waveform through Touchscreen Press the Horiz button the display divides in half The top half of the display shows the Main window and the bottom half displays the Zoom window Vertical Operations The vertical operations in Main Zoom wi...

Page 25: ...zontal Operations When Zoom Window in the bottom menu is selected the horizontal operations using touchscreen are shown in the figure below Main Window Zoom Window Control the horizontal position of Main Window Control the horizontal position of Zoom Window Increase the time base of Zoom Window Decrease the time base of Zoom Window When Main Window in the bottom menu is selected the horizontal ope...

Page 26: ...ly touch the area of the menu item to switch or press the corresponding button to switch See figure below Press repeatedly to switch the options Scroll the list If there is a scroll bar in the left menu or in the file system window you can drag your finger up and down to scroll the list Note When a symbol appears in the menu it indicates you can turn the G knob to select the menu item or set the v...

Page 27: ...em time Touch the time in the top right corner of the screen to display the time setting window Touch to set time Touch to display the Cursor Measure Menu Touch to select the menu item Touch to select the menu item Drag to scroll the list Touch to select the menu item Touch to display the Measure Menu ...

Page 28: ...ad the section of Chapter 4 Junior User Guidebook This chapter will deal with the following topics mainly How to Set the Vertical System Use Mathematical Manipulation Function How to Set the Horizontal System How to Set the Trigger System How to Implement the Sampling Setup How to Set the Display System How to Save and Recall How to Implement the Auxiliary System Function Setting How to Implement ...

Page 29: ...tion of the Channel Menu is shown as the following list Function Menu Setting Description Coupling DC AC Ground Pass both AC and DC components of the input signal Block the DC component of the input signal Disconnect the input signal Impedance 1MΩ 50Ω Select the input impedance to use When 50Ω is selected AC in coupling is not available If the impedance is set to 50Ω when using AC coupling the cou...

Page 30: ...re shown as follows 1 Press the CH1 button to show menu 2 Select Probe in the bottom menu Select 10 in the right menu A list of the probe attenuation coefficient and the corresponding menu settings Attenuation Coefficient of the Probe Corresponding Menu Setting 1 1 X1 10 1 X10 100 1 X100 1000 1 X1000 3 To invert a waveform Waveform inverted the displayed signal is turned 180 degrees against the ph...

Page 31: ...ts of the addition multiplication division and subtraction operations between two channels or the FFT operation for a channel Press the Math button to display the menu on the bottom The corresponding FCL Functional Capabilities List of the Waveform Calculation Function Menu Setting Description Dual Wfm Math Factor1 Select the signal source of the factor1 Operator Select the operator of mathematica...

Page 32: ...u select in the left source menu 4 Select Operator as in the right menu 5 Select Factor2 in the right menu select in the left source menu 6 Select Vertical in the right menu select repeatedly to make the symbol in front of div turn the G knob to adjust the vertical position of Math waveform then select to make the symbol in front of the voltage below turn the G knob to adjust the voltage division ...

Page 33: ... one has trade offs between frequency resolution and magnitude accuracy What you want to measure and your source signal characteristics help you to determine which window to use Use the following guidelines to select the best window Type Characteristics Window Rectangle Best solution for frequency worst for magnitude Best type for measuring the frequency spectrum of nonrepetitive signals and measu...

Page 34: ...e to the same value but have widely differing amplitudes the side lobe level and shape factor are closest to the traditional Gaussian RBW This window is also good for random signals Notes for using FFT Use Zoom function to magnify the FFT waveform if necessary see Zoom the Waveform on P31 Use the default dB scale for details of multiple frequencies even if they have very different amplitudes Use t...

Page 35: ...s control knob changes with the vertical division 2 The VOLTS DIV knob is used to regulate the vertical resolution of the captured waveforms The sensitivity of the vertical division steps as 1 2 5 The information of voltage division is displayed in channel window on the bottom left of the screen Information of vertical position Information of voltage division Figure 5 1 Vertical Information How to...

Page 36: ...ndow Time base of Main window Selected portion Zoom factor and horizontal position of the Zoom window When Main Window is selected in the bottom menu the HORIZONTAL POSITION and SEC DIV knobs are used to adjust the horizontal position and time base of the Main window The time base of Zoom window is changed as well When Zoom Window is selected in the bottom menu the HORIZONTAL POSITION and SEC DIV ...

Page 37: ...igger Menu The button that activates the trigger control menu Trigger Control Trigger Use a trigger level to capture stable waveforms in 4 channels simultaneously Trigger has four modes edge trigger video trigger slope trigger and pulse trigger Edge Trigger It occurs when the trigger input passes through a specified voltage level with the specified slope Video Trigger Trigger on fields or lines fo...

Page 38: ...ls The description of the Video Trigger Menu is as follows MENU SETTING INSTRUCTION Trigger Mode Video Set vertical channel trigger type as video trigger Source Channel 1 as trigger signal Channel 2 as trigger signal Channel 3 as trigger signal Channel 4 as trigger signal Modu NTSC PAL SECAM Select video modulation Sync Line Field Odd Even Line NO Synchronic trigger in video line Synchronic trigge...

Page 39: ...ndition and adjust the G knob to set time Mode Holdoff Auto Normal Single Holdoff Reset Acquire waveform even no trigger occurred Acquire waveform when trigger occurred When trigger occurs acquire one waveform then stop 100ns 10s adjust G knob to set time interval before another trigger occur Set Holdoff time as 100ns 4 Slope Trigger Slope trigger sets the oscilloscope as the positive negative slo...

Page 40: ...trigger level to 0V 2 Trigger Mode The trigger mode determines how the oscilloscope behaves in the absence of a trigger event The oscilloscope provides three trigger modes Auto Normal and Single Auto This sweep mode allows the oscilloscope to acquire waveforms even when it does not detect a trigger condition If no trigger condition occurs while the oscilloscope is waiting for a specific period as ...

Page 41: ...le and 4 immediate execution buttons Autoset Run Stop Single Copy How to Implement Sampling Setup Press the Acquire button select Mode or Length to set sampling The description of the Mode menu is shown as follows Function Menu Setting Description Sample Normal sampling mode Peak detect Use to capture maximal and minimal samples Finding highest and lowest points over adjacent intervals It is used ...

Page 42: ...ser Guidebook 37 Figure 5 2 Peak Detect mode under which the burrs on the falling edge of the square wave can be detected and the noise is heavy Figure 5 3 Normal ACQU Mode display in which no burr can be detected ...

Page 43: ...on Wave Display Type Dots Vect Only the sampling points are displayed The space between the adjacent sampling points in the display is filled with the vector form Persist Time OFF 100ms 200ms 9 9s 10s Infinity Turn the G knob to set the persistence time Persistence OFF Turn off persistence and clear the display Clear Erase the results of previous acquisitions from the display The oscilloscope will...

Page 44: ...her The data point from the first waveform specifies the horizontal location while the corresponding data point from the second waveform specifies the vertical location for each displayed point The red waveform is CH1 versus CH2 the purple waveform is CH3 versus CH4 The oscilloscope is set in the un triggered sample mode the data are displayed as bright spots The operations of all control knobs are a...

Page 45: ...an measure frequency correctly It is a one channel cymometer and it can only measure the frequency of the triggering channel The cymometer is displayed at the right bottom of the screen To turn the cymometer on or off 1 Press the Acquire button 2 Select Cymometer as ON or OFF in the bottom menu How to Save and Recall Oscilloscope screen images can be saved to internal external storage in JPG BMP o...

Page 46: ...al storage To save the current waveform data 1 Press the Save button 2 Select Save in the bottom menu select Save Waveform 3 Select Source in the right menu in the left menu select an opened channel or a previously stored reference waveform 4 Select Destination in the right menu in the left menu select one of 4 reference waveforms R1 R4 or select File to save to internal external storage 5 Select ...

Page 47: ... right menu You can also save setup files by just pressing the Copy button see To save with Copy button push on P44 To display remove reference waveforms 1 Press the Save button 2 Select Ref in the bottom menu 3 For R1 R4 switch to ON the reference waveform will be displayed switch to OFF the reference waveform will be removed You can display multiple reference waveforms at the same time 4 When th...

Page 48: ...o select the path or file in file explorer Introduction of the drive letters D Internal storage E F etc The USB flash drive plugged into the USB port of the oscilloscope In file explorer you can use touchscreen or the G knob to select the storage folder or file Using touchscreen You can drag your finger up or down to scroll the file list touch the drive letter folder or file to select Touch the dri...

Page 49: ...ation to save image to external storage then each push of the Copy button will save current screen image to the defined external storage To define the Copy button behavior follow the steps below 1 Press the Save button 2 Select Save to Config in the bottom menu 3 Select the save type from Screen Image Waveform and Setup 4 Select Change folder to define the save path see To select the path or file in...

Page 50: ...he numbers Select the number keys below in the dialog to change the value the range of each byte is 0 255 The range of Port is 0 65535 Touch to delete current byte Touch to complete the setting To change the date and time 1 Press the Utility button select Config in the left menu 2 Select Time Config in the bottom menu the Time Setting dialog will pop up 3 Touch the value that needs to be changed a...

Page 51: ...in the left menu select Self Calibrate in the bottom menu A confirmation window will pop up select OK after everything is ready Pass Fail The Pass Fail function monitors changes of signals and output pass or fail signals by comparing the input signal that is within the pre defined mask Press the Utility button and select Pass Fail in the left menu Function Menu Setting Description BackLight 0 99 D...

Page 52: ...ve rule Select Save rule in the bottom menu Select Save in the right menu to enter file explorer The path and file name are shown in the Save To line in the bottom Select the save location see To select the path or file in file explorer on P43 If you want to customize the file name select Edit Filename in the right menu see To edit file names on P43 Select OK Save in the right menu 7 Recall rule S...

Page 53: ...u The description of Sync Output menu is shown as the follows System Press the Utility button and select System in the left menu The description of System menu is shown as the follows Function Menu Setting Description Type Trig level Pass Fail Output trig signal synchronously Output High Level when Pass and Low Level when Fail Function Menu Description Help Select a topic in Help catalog to view t...

Page 54: ... measures Delete Delete the chosen measure type Measure Only if the waveform channel is in the ON state the measurement can be performed The automatic measurement cannot be performed in the following situation 1 On the reference waveform 2 On the Math waveform 3 On the XY format 4 On the Scan format Measure the frequency the period of the Channel CH1 and the mean the PK PK of the Channel CH2 follo...

Page 55: ...ement of voltage parameters The TDS series oscilloscopes provide automatic voltage measurements including PK PK Max Min Mean Vamp RMS Vtop Vbase Overshoot and Preshoot Figure 5 8 below shows a pulse with some of the voltage measurement points Max Min PK PK Vtop Vbase Vamp Overshoot Preshoot Figure 5 8 PK PK Peak to Peak Voltage Max The maximum amplitude The most positive peak voltage measured over...

Page 56: ...o measurements include Frequency Period Rise Time Fall Time Width Width Duty Duty Delay Delay Delay Delay Figure 5 9 shows a pulse with some of the time measurement points Rise Time Fall Time Width Width Figure 5 9 Rise Time Time that the leading edge of the first pulse in the waveform takes to rise from 10 to 90 of its amplitude Fall Time Time that the falling edge of the first pulse in the wavef...

Page 57: ...e G knob to adjust the position of L1 L2 Turn the G knob to adjust the position of L2 L1 L2 Two cursors are linked Turn the G knob to adjust the two cursors together Perform the steps below for the voltage cursor measurement of the channel CH1 1 Press the Cursor button 2 Select Source in the bottom menu select in the left menu 3 Select Type in the bottom menu select Voltage in the right menu Two r...

Page 58: ...o red dotted lines displayed along the vertical direction of the screen which indicating L1 and L2 4 Select Line in the bottom menu select L1 in the right menu The icon will appear beside the dotted line of L1 represents you can turn the G knob to adjust the position of L1 Select L2 to adjust the position of L2 Select L1 L2 to adjust the two cursors together The cursor measure window at the top ri...

Page 59: ...ight menu Two blue dotted lines displayed along the horizontal direction of the screen which indicating L1 and L2 4 Select Line in the bottom menu select L1 in the right menu The icon will appear beside the dotted line of L1 represents you can turn the G knob to adjust the position of L1 Select L2 to adjust the position of L2 Select L1 L2 to adjust the two cursors together The cursor measure windo...

Page 60: ...dotted lines displayed along the vertical direction of the screen which indicating L1 and L2 4 Select Line in the bottom menu select L1 in the right menu The icon will appear beside the dotted line of L1 represents you can turn the G knob to adjust the position of L1 Select L2 to adjust the position of L2 Select L1 L2 to adjust the two cursors together The cursor measure window at the top right sh...

Page 61: ... frequency of the signals Press the Autoscale button to display the function menu in the bottom The menu is as follows Function Menu Setting Instruction AutoScale ON OFF Turn on Autoscale Turn off Autoscale Mode Follow up and adjust both vertical and horizontal settings Follow up and only adjust horizontal scale Follow up and only adjust vertical scale Wave Period Show Multi period waveforms Only ...

Page 62: ...ng 4 In the Autoscale mode if you adjust the vertical position voltage division trigger level or time scale of CH1 CH4 the oscilloscope will turn off Autoscale function 5 While the Autoscale is working settings below will be made forcibly 1 If it is in zoom mode previously the zoom mode will be turned off 2 The acquire mode will be set as Sample How to Use Executive Buttons Executive Buttons inclu...

Page 63: ...ling on input signals Notice When there is no sampling at STOP state the vertical division and the horizontal time base of the waveform still can be adjusted within a certain range in other words the signal can be expanded in the horizontal or vertical direction Single Press this button you can set the trigger mode as single directly so when trigger occurs acquire one waveform then stop Copy You c...

Page 64: ...se a USB data cable to connect the USB Device port in the rear panel of the Oscilloscope to the USB port of a PC 2 Install the driver Run the communication software on PC press F1 to open the help document Follow the steps of title I Device connection in the document to install the driver 3 Port setting of the software Run the software click Communications in the menu bar choose Ports Settings in ...

Page 65: ...ddress Here we set the IP address to 192 168 1 71 Figure 6 2 Set the network parameters of the computer 3 Set the network parameters of the Software Run the software on the computer choose the Ports settings of the Communications menu item Set Connect using to LAN About the IP the first three bytes is same as the IP in the step 2 the last byte should be different Here we set it to 192 168 1 72 The...

Page 66: ...rmally in the software the connection is successful Figure 6 4 Set the network parameters of the oscilloscope Connect through a router 1 Connection Use a LAN line to connect the oscilloscope with a router the LAN port of the oscilloscope is in the rear panel the computer should be connected to the router too 2 Set the network parameters of the computer Since the oscilloscope cannot support obtaini...

Page 67: ... to LAN About the IP the first three bytes is same as the IP in the step 2 the last byte should be different Here we set it to 192 168 1 72 The range of the port value is 0 65535 but the port which under 2000 is always be used so it is suggested to set it to the value above 2000 Here we set it to 3000 Figure 6 6 Set the network parameters of the Software 4 Set the network parameters of the oscillo...

Page 68: ...re in step 3 The Netmask and Gateway should be set according to the router You can refer to To set the network parameters on P45 Touch to complete the setting If you can get data normally in the software the connection is successful Figure 6 7 Set the network parameters of the oscilloscope To learn about how to operate the software you can press F1 in the software to open the help document ...

Page 69: ...c Measurement The oscilloscope can measure most of the displayed signals automatically To measure the period and frequency of the Channel 1 and the mean and peak to peak voltage of the Channel 2 follow below steps 1 Press the Measure button 2 Select Add in the bottom menu 3 Select Source in the right menu select in the left menu 4 Select Type in the right menu select Period in the left menu 5 Sele...

Page 70: ...onnect the oscilloscope CH1 channel with the circuit signal input end and the CH2 channel to the output end Operation Steps 1 Press the Autoset button and the oscilloscope will automatically adjust the waveforms of the two channels into the proper display state 2 Press the Measure button 3 Select Add in the bottom menu 4 Select Source in the right menu select in the left menu 5 Select Type in the ...

Page 71: ...user to make few small adjustments to achieve a proper trigger level and mode Here is how we achieve this The operation steps are as follows 1 Set the probe menu attenuation coefficient to 10X and that of the switch in the probe to 10X see How to Set the Probe Attenuation Coefficient on P13 2 Adjust the VOLTS DIV and SEC DIV knobs to set up a proper vertical and horizontal ranges for the signal to...

Page 72: ...e want to find a burst burr of high amplitude set the trigger level to a slightly higher value of the average signal level press the Run Stop button and wait a trigger Once there is a burr occurring the instrument will trigger automatically and record the waveform during the period around the trigger time By turning the HORIZONTAL POSITION knob in the horizontal control area in the panel you can c...

Page 73: ...l displayed on the screen containing some noise by turning on Peak Detect function and changing time base to slow down the incoming signal any peaks or burr would be detected by the function see Figure 7 4 Figure 7 4 Signal with Noises Separate Noises from the Signal When focusing on signal itself the important thing is to reduce the noise level as lower as possible this would enable user to have ...

Page 74: ...ter it passes a specified circuit Input signal to the circuit and output signal from circuit are used as source signals For the examination of the input and output of the circuit in the form of X Y coordinate graph please operate according to the following steps 1 Set the probe menu attenuation coefficient for 10X and that of the switch in the probe for 10X see How to Set the Probe Attenuation Coe...

Page 75: ... q is the phase difference angle and the definitions of A B C and D are shown as the graph above As a result the phase difference angle can be obtained namely q arcsin A B or arcsin C D If the principal axis of the ellipse is in the I and III quadrants the determined phase difference angel should be in the I and IV quadrants that is in the range of 0 π 2 or 3π 2 2π If the principal axis of the ell...

Page 76: ...ollowing steps 1 Press the TRIGGER Menu button 2 Select Trig Mode in the bottom menu select Video in the left menu 3 Select Source in the bottom menu select in the left menu 4 Select Modu in the bottom menu select NTSC in the right menu 5 Select Sync in the bottom menu select Field in the right menu 6 Turn the VOLTS DIV VERTICAL POSITION and SEC DIV knobs to obtain a proper waveform display see Fi...

Page 77: ... match see How to Set the Probe Attenuation Coefficient on P13 4 There is a waveform displayed but it is not stable Check whether the Source item in the TRIG MODE menu is in conformity with the signal channel used in the practical application Check on the trigger Type item The common signal chooses the Edge trigger mode for Type and the video signal the Video Only if a proper trigger mode is appli...

Page 78: ...ation on P14 All specification standards can be fulfilled except one s marked with the word Typical Performance Characteristics Instruction Bandwidth TDS7104 TDS8104 100MHz TDS8204 200MHz Channel 4 Acquisition Mode Normal Peak detect Averaging Waveform Capture rate 50 000 Max Sample rate real time TDS7104 Four CH 500MS s Dual CH 1GS s Single CH 1GS s TDS8104 TDS8204 Four CH 1GS s Dual CH 2GS s Sin...

Page 79: ...iv 2ns div 100s div step by 1 2 5 Sampling rate relay time accuracy 100ppm Interval T accuracy DC 100MHz Single 1 interval time 100ppm reading 0 6ns Average 16 1 interval time 100ppm reading 0 4ns Vertical system A D converter 8 bits resolution 4 Channels simultaneously Sensitivity 2mV div 10V div Displacement 10 div Analog bandwidth TDS7104 TDS8104 100MHz TDS8204 200MHz Low Frequency 5Hz at input...

Page 80: ... Dual CH Select one of the channels in CH1 and CH2 and the other one in CH3 and CH4 Trigger Performance Characteristics Instruction Trigger level range Internal 6 div from the screen center Trigger level Accuracy typical Internal 0 3div Trigger displacement According to Record length and time base Trigger Holdoff range 100ns 10s 50 level setting typical Input signal frequency 50Hz Edge trigger slo...

Page 81: ...k to Peak voltage 1MΩ Frequency Typical Square wave of 1KHz Power Mains Voltage 100 240 VAC RMS 50 60Hz CAT II Power Consumption 24W Environment Temperature Working temperature 0 40 Storage temperature 20 60 Relative Humidity 90 Height Operating 3 000 m Non operating 15 000 m Cooling Method Natural convection Mechanical Specifications Dimension 380mm 180mm 115mm L H W Weight About 1 9kg Interval P...

Page 82: ... and probes as often as operating conditions require To clean the instrument exterior perform the following steps 1 Wipe the dust from the instrument and probe surface with a soft cloth Do not make any scuffing on the transparent LCD protection screen when clean the LCD screen 2 Disconnect power before cleaning your Oscilloscope Clean the instrument with a wet soft cloth not dripping water It is r...

Reviews: