


CHAPTER NINE
TEOAE test
82
9.3
TEOAE recording
Following
Checkfit,
the OAE recording begins and data is collected and
displayed on a choice of four test screens - two OAE histograms and
two data tables. The screens are continually updated to give a real time
representation of the OAE response. The histogram is the default screen
shown at the beginning of a test and the left/right arrow
keys can be used
to toggle between the screen choices when a test is in progress.
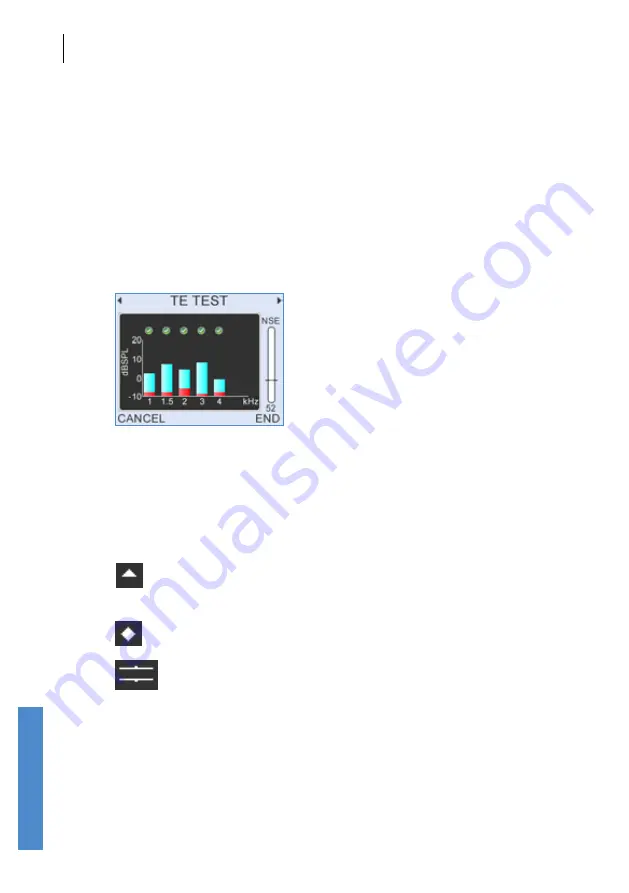
9.3.1
Half-octave histogram
Test data is displayed graphically on the histogram screen in ½ octave
bands: 1k, 1.5k, 2k, 3k, 4k and 6kHz (optional). The blue section of each
band represents the OAE signal level within each band and the red section
represents the noise level at that frequency.
A tick will appear above a bar if the TE in the half-octave band has met
its Stop criteria. Please refer to the
Test Setup
(chapter
17
) for further
information on the band Stop criteria.
If either the OAE signal or noise level at a frequency band is greater
than 20dB SPL, an up arrow will appear above the band to the right
of the tick to show the level is off the graphical scale.
If no data has been collected, then a histogram will not be drawn and
diamond symbols will be shown instead.
Brackets can be displayed to indicate normative ranges (see
chapter
17
Test setup
).
Common to all three screens is a noise level indicator to the right of the
display, the title bar at the top of the screen and the
Cancel
and
End
options.
TEOAE test
Summary of Contents for Otoport Advance
Page 296: ...CHAPTER THIRTY TWO Index 296...


