


LBL-2008-41-v5 OptoMonitor 3 IFU_en Rev 2021-08
66
|
P a g e
6-
Pressing the “Play” button will cause the recording to replay as if it was a live measurement,
from time =0 seconds. Press the “Stop” button at any time during the replay to end it and return
to the playback screen.
7-
The Archive button enables the viewing of all previous recordings. The user can upload the
recordings to a USB drive (or through DICOM export) by accessing the Archive menu. See section
7.10.4 for more details.
8-
Pressing the “Live” button sends the screen back to the MAIN screen, where live measurements
resume, and another recording can be initiated.
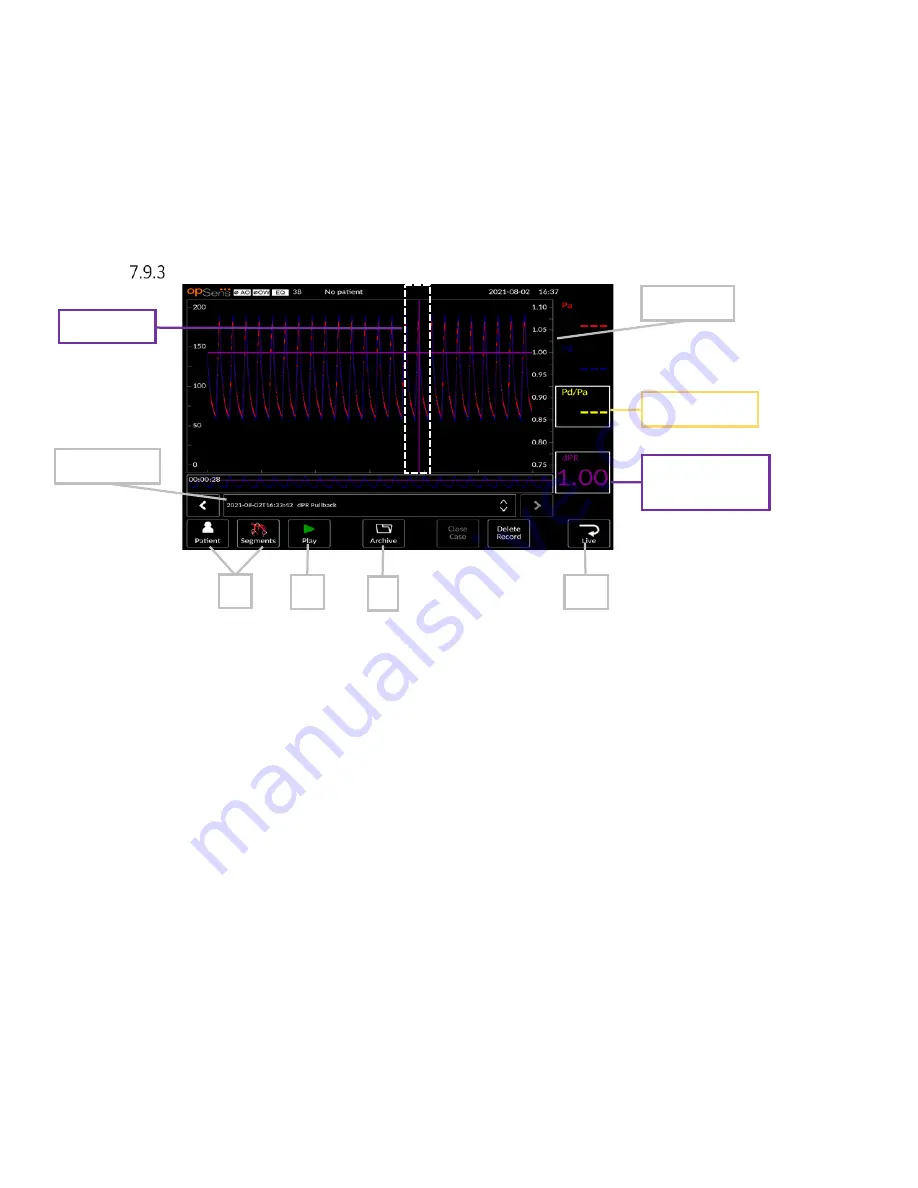
Viewing dPR Pullback in Playback Mode
1-
Upon completion of a dPR Pullback recording, the screen will automatically switch to playback
mode where the user can see all the recorded data of the current patient. If you wish to access
playback mode without performing a recording, press the “View” button on the MAIN screen.
2-
All locally stored recordings for the current patient will appear in the recording selection box. If
no case is open, all non-case recordings will appear in the selection box. The user can use their
finger to scroll up/down to view all locally stored recordings and can tap a desired recording to
load it into the graphical window and data window.
3-
A dPR Pullback records a live calculation of dPR while the physician pulls the sensor wire across a
lesion or area of interest.
4-
The minimum (non-zero) dPR value calculated over the length of the recording is displayed in
the data window under “dPR” (default purple). Minimum dPR is also marked by a purple line in
the graphical window. The live dPR value is defined by the right axis of the graph.
5-
The user can use their finger to scroll the marker left/right to view specific sections of the
recording and identify regions of interest. dPR values in the data window will update as the
marker moves.
6-
The dPR button localizes the minimum dPR value within the entire recorded data and updates
the dPR value in the data window.
7-
The user can apply the ‘patient’ and ‘segments’ functions to the recording.
8-
Pressing the “Play” button will cause the recording to replay as if it was a live measurement,
from time =0 seconds. During this replay, the live value of dPR is displayed in the bottom of the
7
8
10
dPR button,
minimum dPR
Recordings
dPR cursor
Pd/Pa button
dPR scale
9