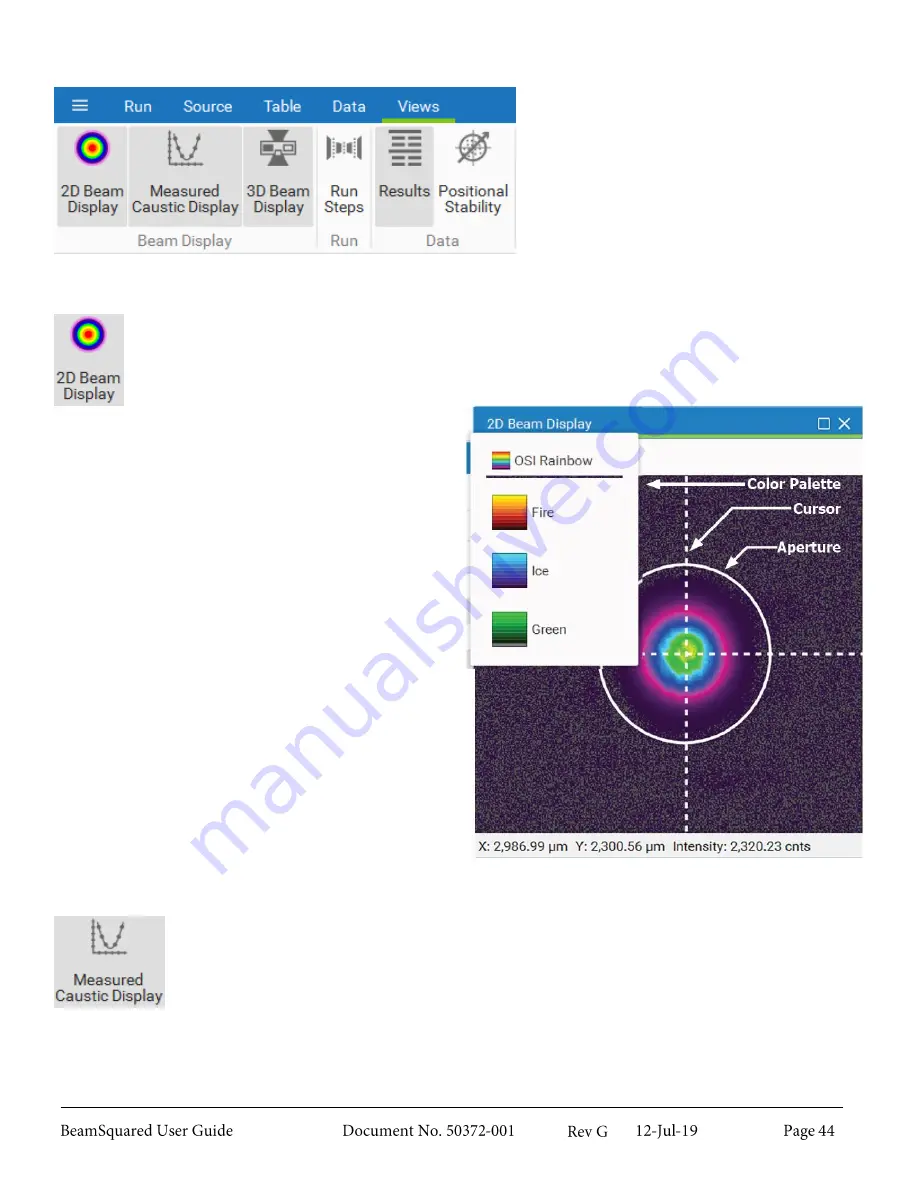
Views Ribbon
3.7
This ribbon allows you to open and close
windows in the display area.
2D Beam Display
3.7.1
The
2D Beam Display
presents the real-time data from the camera or the current frame in the
Measured Caustic Display
if a run has completed or a saved file is open.
Left-click and drag to pan the display area, and scroll
the mouse wheel to zoom.
When
Live Playback
is enabled, the cursor position
defaults to the center of the display. Left-click and
drag the cursor to move it manually.
The aperture around the beam marks the area where
calculations are computed. The aperture is always
circular or elliptical and is drawn automatically.
The X and Y values (bottom) display the cursor
location in relation to the bottom left corner of the
sensor. The units follow the width units selected in
the
Results Settings
(see section 3.7.5.1).
The
Intensity
(bottom) displays the pixel value in
digital counts at the cursor location.
The color palette drop-down (top left) displays color
palette options for the beam profiles. Palettes are
designed to work with a variety of laser safety eye-
wear.
Measured Caustic Display
3.7.2
The
Measured Caustic Display
window shows the after lens X and Y beam widths plotted
against the Z axis locations. The units for each scale are selected in the
Results Settings
in
the
Results
window, and the solid lines are the resulting curve fits of the beam propagation
equation. The plotted data auto-scales to fit the window.
Scroll the mouse wheel to zoom and left-click and drag to pan the display area.
Single-click a data point to select and view it in the
2D Beam Display
. The results for the selected frame
appear in the
Frame (Quantitative)
section of the
Results
window.
Summary of Contents for BeamSquared
Page 10: ......
Page 15: ...BeamSquared Optical Train Dimensions 1 4 ...
Page 75: ...400mm Focal Length Lens M2 1 500mm Focal Length Lens M2 1 ...
Page 87: ......


