background image

DMTA-10055-01EN, Rev. A, February 2015

Software Interface


81

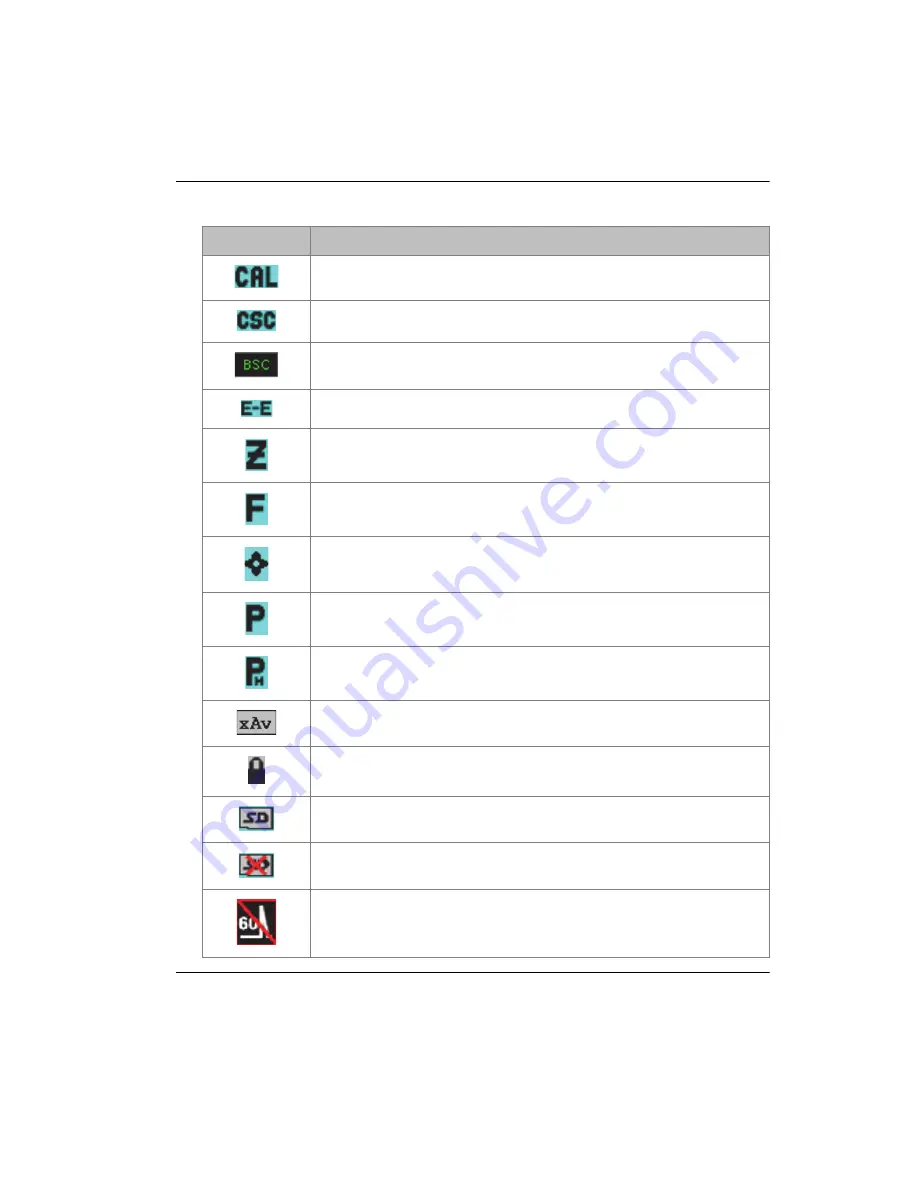
Calibration is active.

Curved surface correction (CSC) is active.

B-scan is active.

Gate tracking (Echo-to-Echo) is active.

Zoom is active.

FREEZE is active.

Auto FREEZE is active.

PEAK MEM is active.

2

ND

F

,

 (PEAK HOLD) 

reference echo is active.

Waveform averaging is active.

Access to all instrument functions except ON/OFF is locked.

Indicates that a microSD card is installed.

Indicates that the microSD card is not installed.

Current settings are restricting waveform update rate below 
60 Hz.

Table 7  Flag description 

(continued)

Flag

Description

Summary of Contents for EPOCH 650

Page 1: ...Manual This instruction manual contains essential information on how to use this Olympus product safely and effectively Before using this product thoroughly review this instruction manual Use the pro...

Page 2: ...d therein and corresponds to the version of the product manufactured prior to the date appearing on the title page There could however be some differences between the manual and the product if the pro...

Page 3: ...patibility 6 Repair and Modification 6 Safety Symbols 7 Safety Signal Words 7 Note Signal Words 8 Safety 9 Warnings 9 Battery Precautions 10 Equipment Disposal 11 CE European Community 11 WEEE Directi...

Page 4: ...nput and Output Pins 36 1 2 3 VGA Out Connector 36 1 2 4 USB Client Port and microSD Card Slot 37 1 2 4 1 USB Client Port 38 1 2 4 2 microSD Card Slot 39 1 3 Battery Compartment 40 1 4 Instrument Stan...

Page 5: ...ent Reading Boxes 77 4 5 Live Scan Area 78 4 6 Flags 78 4 7 Menu Contents 82 4 8 Setup Pages 86 4 8 1 Entering an Alphanumeric Value Using the Virtual Keyboard 87 4 8 2 Display Setup Page 89 4 8 3 Gri...

Page 6: ...ly Adjusting Basic Gate Parameters 125 7 3 Gate Measurement Modes 126 7 4 Viewing Measurement Readings 130 7 5 Gate Tracking and Echo to Echo Measurements 130 7 6 Operating in Time of Flight Mode 132...

Page 7: ...gle Beam Transducer 175 9 10 Curved Surface Correction 180 9 11 Common Angle Beam Calibration Block Diagrams 181 10 Data Logger 187 10 1 Data File Types 188 10 1 1 Calibration file type 188 10 1 2 Inc...

Page 8: ...3 2 Curve Adjustment Gain DAC Gain or TCG Gain 236 11 2 3 3 Transfer Correction 237 11 2 4 JIS DAC 238 11 2 5 Custom DAC Curves 238 11 3 DGS AVG 240 11 3 1 Option Activation and Setup 241 11 3 2 Curv...

Page 9: ...78 11 9 4 Basic Measurement Adjustments 280 11 9 4 1 Rectification 280 11 9 4 2 Extended Blank Control 280 11 9 4 3 Manual Gain Adjustment 281 11 9 5 Calibration for Additional Accuracy 283 11 9 6 Ech...

Page 10: ...ation file type 309 B 2 Incremental file type 309 B 3 Advanced File Types 312 B 3 1 Sequential 312 B 3 2 2 D Matrix Grid 314 B 3 3 2 D EPRI 317 B 3 4 2 D Matrix Grid with Custom Point 317 B 3 5 3 D Ma...

Page 11: ...y BEA back wall echo attenuator BIP beam index point CSC curved surface correction DAC distance amplitude correction DC direct current DGS distance gain size EFUP environment friendly use period FSH f...

Page 12: ...DMTA 10055 01EN Rev A February 2015 List of Abbreviations xii...

Page 13: ...and symbols are attached to the instrument at the locations shown in Figure i 1 on page 1 Figure i 2 on page 2 and Figure i 3 on page 2 If any or all of the labels or symbols are missing or illegible...

Page 14: ...ouch the inner conductor of the BNC or LEMO connectors Up to 400 V can be present on the inner conductors The warning symbol shown in Figure i 3 on page 2 warns of this electric shock risk Figure i 3...

Page 15: ...aste but should be collected separately The regulatory compliance mark RCM label indicates that the product complies with all applicable standards and has been registered with the Australian Communica...

Page 16: ...uct s Environment Friendly Use Period EFUP The EFUP is defined as the number of years for which listed controlled substances will not leak or chemically deteriorate while in the product The EFUP for t...

Page 17: ...rcial materials Do not use the EPOCH 650 for any purpose other than its intended use It must never be used to inspect or examine human or animal body parts Instruction Manual This instruction manual c...

Page 18: ...echargeable lithium ion Li ion battery pack PN 600 BAT L 3 U8051431 Optional standalone external battery charger PN EPXT EC x Varies by configuration must select a power cord Charger adaptor PN EP MCA...

Page 19: ...arm or material damage High voltage warning symbol This symbol is used to alert the user to potential electric shock hazards greater than 1000 volts All safety messages that follow this symbol shall b...

Page 20: ...duct destruction of part or all of the product or loss of data Do not proceed beyond a CAUTION signal word until the indicated conditions are fully understood and met Note Signal Words The following s...

Page 21: ...instrument and in this instruction manual If the equipment is used in a manner not specified by the manufacturer the protection provided by the equipment could be impaired Do not install substitute pa...

Page 22: ...own in these regulations thus contributing to worldwide harmonization in this field These international organizations include the International Civil Aviation organization ICAO the International Air T...

Page 23: ...uring instrument storage Equipment Disposal Before disposing of the EPOCH 650 check your local laws rules and regulations and follow them accordingly CE European Community WEEE Directive This device c...

Page 24: ...se interference The EPOCH 650 has been tested and found to comply with the limits for an industrial device in accordance with the specifications of the EMC directive FCC USA Compliance This device com...

Page 25: ...own expense ICES 001 Canada Compliance This Class A digital apparatus complies with Canadian ICES 001 Cet appareil num rique de la classe A est conforme la norme NMB 001 du Canada Warranty Informatio...

Page 26: ...plied that the techniques examples or procedures described herein are consistent with industry standards nor that they meet the requirements of any particular application Olympus reserves the right to...

Page 27: ...an intuitive user interface The EPOCH 650 features many performance durability and operational enhancements when compared to previous EPOCH flaw detectors These enhancements include Case sealed to the...

Page 28: ...s a continuously self calibrating instrument you must determine regulatory requirements Olympus offers calibration and documentation services Contact Olympus or your local representative with any spec...

Page 29: ...DMTA 10055 01EN Rev A February 2015 Introduction 17 Figure i 4 Transport case contents For a list of optional accessories see the parts list on page 331 4 Lock 5 6 3 2 1...

Page 30: ...DMTA 10055 01EN Rev A February 2015 Introduction 18...

Page 31: ...n page 19 and Figure 1 2 on page 20 show the EPOCH 650 ultrasonic flaw detector and identify its main components Figure 1 1 EPOCH 650 front view Protective rubber bumpers 4 D rings 4 to attach the opt...

Page 32: ...tion parameters and easy adjustment of values from either side of the instrument without obstructing the view of the display The EPOCH 650 is available in two front panel configurations to accommodate...

Page 33: ...tion pad configuration Direct access keys Function keys Parameter keys Alarm indicators Power key Display window Adjustment knob Parameter lock key Check and Escape keys Power indicator Direct access...

Page 34: ...ween coarse and fine see Figure 1 5 on page 22 Coarse adjustment is active when the highlighted parameter is surrounded by brackets Fine adjustment is active when there are no brackets Figure 1 5 Coar...

Page 35: ...DMTA 10055 01EN Rev A February 2015 Hardware Overview 23 Figure 1 6 The EPOCH 650 Adjustment knob configuration Adjustment knob Check and Escape keys Direct access keys...

Page 36: ...lish the EPOCH 650 is also offered with an international symbol version of the adjustment knob configuration see Figure 1 7 on page 24 Figure 1 7 Knob configuration English and international versions...

Page 37: ...ese versions 1 1 2 Navigation Pad Configuration The navigation pad configuration is similar to previous EPOCH instruments to provide easy transitions within the EPOCH product line see Figure 1 9 on pa...

Page 38: ...screen When in a selected menu returns to the Basic menu item When a direct access parameter gain range gates etc is selected returns to the previous menu The direct access keys cause the software int...

Page 39: ...50 is also offered with an international symbol version of the navigation pad configuration see Figure 1 10 on page 27 Figure 1 10 Pad configuration English and international versions Arrow keys Check...

Page 40: ...vigation pad configuration see Figure 1 11 on page 28 Figure 1 11 Pad configuration Chinese and Japanese versions 1 1 3 Direct Access Keys Table 3 on page 29 presents a description of each of the key...

Page 41: ...d ID knob configuration only FREEZE Freezes holds the displayed waveform until FREEZE is pressed again GATES Selects gates 1 2 or IF on the screen 2ND F AUTO XX Automatically adjusts gated signal to X...

Page 42: ...located around the display see Figure 1 12 on page 31 On the display menu system software buttons appear vertically on the right side and horizontally at the bottom see Figure 1 13 on page 32 The fun...

Page 43: ...DMTA 10055 01EN Rev A February 2015 Hardware Overview 31 Figure 1 12 Function and parameter keys Function keys Parameter keys Parameter lock key...

Page 44: ...es of the power indicator Figure 1 14 AC charger adaptor power indicator 1 1 6 Alarm Indicators The EPOCH 650 ultrasonic flaw detector provides three alarm indicator lights see Figure 1 15 on page 33...

Page 45: ...connector is chosen at the time of order If necessary it is possible to change the type of transducer connection at an authorized Olympus service center for a small charge Selection of these transduce...

Page 46: ...nnectors See Input Output Specifications on page 305 for the complete specifications of the supported I O signals 1 2 2 Digital Out Connector The EPOCH 650 ultrasonic flaw detector comes standard with...

Page 47: ...WM output This output is enabled by any alarm condition on the instrument and is intended to provide an output to control an external horn or beeper The N600 EXTALM U8780332 external alarm box optiona...

Page 48: ...onnector The VGA Out connector is located at the back of the EPOCH 650 ultrasonic flaw detector see Figure 1 17 on page 37 A rubber cover protects the connector Using the VGA output you can display th...

Page 49: ...microSD card slot and USB port are located on the right side of the EPOCH 650 ultrasonic flaw detector A protective cover has an integral membrane seal to keep out liquids see Figure 1 18 on page 38 T...

Page 50: ...an pass commands to the EPOCH 650 but the EPOCH 650 cannot pass commands to a peripheral device To connect any device including a personal computer to the EPOCH 650 an appropriate USB cable is require...

Page 51: ...s and then open the computer connection protective cover see Figure 1 19 on page 39 3 Hold the microSD card so that the metal pins face toward the front of the instrument 4 Carefully slide the card in...

Page 52: ...n the inside by an environmentally sealed membrane vent The membrane vent is a safety feature that is required in the event that the instrument battery fails and emits gas This vent must not be punctu...

Page 53: ...ulating pipe stand for variable viewing angles see Figure 1 21 on page 41 The stand is attached to the back of the instrument with two hard pivot blocks and has a high friction coating for resistance...

Page 54: ...DMTA 10055 01EN Rev A February 2015 Chapter 1 42...

Page 55: ...ger adaptor Whatever source is selected the power on off procedure is the same To power on or off the EPOCH 650 1 Press the Power button to turn on the EPOCH 650 see Figure 2 1 on page 43 Pressing thi...

Page 56: ...ument out into the field see Table 4 on page 47 for information on reading the charging status The battery may require several complete charge discharge cycles to reach full capacity This conditioning...

Page 57: ...r adaptor allows you to power the EPOCH 650 When a lithium ion rechargeable battery is installed in the instrument and the charger adaptor is connected the battery charges The EPOCH 650 charger adapto...

Page 58: ...overs the AC charger adaptor connector on top of the EPOCH 650 instrument 3 Connect the DC power plug to the DC adaptor connector see Figure 2 3 on page 46 Figure 2 3 Connecting the DC power plug AC m...

Page 59: ...er status of the AC charger adaptor and the battery charge status are indicated by both the front panel AC charger adaptor power indicator see Figure 2 4 on page 47 and the user interface Battery AC i...

Page 60: ...ary 2015 Chapter 2 48 Green No Li ion battery level as indicated by the black horizontal bar Table 4 EPOCH 650 power status indicators continued AC charger adaptor power indicator AC power connected S...

Page 61: ...or located in the lower right corner of the software main display shows which menu is currently selected see Figure 3 1 on page 49 For example the menu indicator showing 1 5 means that there are five...

Page 62: ...the first function menu item in each of the five menu groups is the default selection see Figure 3 2 on page 50 Only one function menu item at a time can be selected To choose a function menu item Pr...

Page 63: ...d the corresponding function button remains green see Figure 3 4 on page 51 Figure 3 4 The focus is on the selected parameter green To select a parameter Press the corresponding parameter key For exam...

Page 64: ...epresents the name of the parameter example Unit Value represents the desired editable or selectable parameter value example mm For example to instruct you to set the Unit parameter to mm in the Meas...

Page 65: ...adjustment knob configurations you can customize preset values for coarse adjustment see Editable Parameters Page on page 102 3 5 Escape Key The Escape key has three primary functions When in a setup...

Page 66: ...o set the gated echo amplitude to XX of full screen height the default XX value is 80 See Figure 3 7 on page 54 Figure 3 7 The AUTO XX feature inactive left and active right 3 8 Submenus When selectin...

Page 67: ...the parameter keys to choose the corresponding preset value You can automatically adjust gain using the AUTO XX feature See Escape Key on page 53 3 9 2 Reference Gain You can define a reference gain b...

Page 68: ...PRF in 10 Hz increments PRF Pulse Repetition Frequency values range from 10 Hz to 2000 Hz in 10 Hz increments Energy Pulse voltage values available 0 V 100 V 200 V 300 V or 400 V Damp Pulse damping v...

Page 69: ...given application Each filter is a fully digital filter set Table 5 on page 57 lists the low pass and high pass cutoffs for each available filter Table 5 Filter cutoffs 0 2 MHz 10 MHz 2 0 MHz 21 5 MHz...

Page 70: ...djusting Basic Gate Parameters The GATES direct access key allows instant access to gate start width and level adjustments without requiring the user to enter any gate related menus This is the most c...

Page 71: ...when the Alarm parameter is set to Min Depth Adjusts the threshold in time of flight units that triggers a Min Depth alarm condition AFreeze Visible only when Alarm is Positive or Negative Activates...

Page 72: ...the first crossing point of a gated signal see Figure 3 10 on page 60 Peak Acquires measurement readings based on the highest peak within the gated region does not have to cross the gate threshold Se...

Page 73: ...an alarm is triggered on either measurement gate you are alerted in two different ways The EPOCH 650 emits an audible tone One of two alarm indicators LEDs is illuminated on the instrument front pane...

Page 74: ...page 143 for more detailed calibration information 3 11 1 Measurement calibration Calibration for accurate digital measurements is typically accomplished using two known thicknesses of a representati...

Page 75: ...e parameter then select the appropriate calibration type Thickness for straight beam or Soundpath for angle beam are the most common 6 Select Cal Zero 7 Adjust the displayed value to the appropriate t...

Page 76: ...to accept the adjusted value and then move on to the second calibration step 9 Couple the transducer to the thick step of material 10 Position gate 1 around the resulting indication on screen 11 Brin...

Page 77: ...Overview 65 Figure 3 15 The gate 1 start 12 Select Cal Vel 13 Use the knob or arrow keys to adjust the displayed value to the appropriate thickness For this example the transducer is coupled to a 12 5...

Page 78: ...66 Figure 3 16 The Velocity Cal value 14 Select Done to accept the adjusted value and complete the calibration process 15 Press RANGE and then adjust the screen range to the desired setting see Figur...

Page 79: ...e see Verifying the Refracted Angle on page 167 3 Complete the distance calibration using Measurement calibration on page 62 Calibration mode set to SoundPath or Depth depending on the reflector type...

Page 80: ...p and storage of the most basic and common file type the calibration file For full details and procedures on standard and optional file types see Data Logger on page 187 3 12 1 Calibration Files To se...

Page 81: ...ng process For creation of an incremental Inc file you must first create a Start Point 9 Press NEXT until the Create button is highlighted 10 Select the Save parameter The Save parameter creates the f...

Page 82: ...t save any file parameters to the file until you press 2ND F SAVE This is typically used for inspection files where the file is created before the start of the inspection 11 Press YES P1 key to accept...

Page 83: ...s reset Resets only the current on screen parameters to system default values does not affect saved files Storage Reset Deletes all saved files with no effect on live instrument settings Only the defa...

Page 84: ...DMTA 10055 01EN Rev A February 2015 Chapter 3 72...

Page 85: ...play elements For information on selecting functions and parameters see Software Overview on page 49 through Submenus on page 54 The main display in full screen mode is shown in Figure 4 2 on page 74...

Page 86: ...he full screen to normal screen size Figure 4 2 Software display elements in full screen mode 4 1 Button Types Table 6 on page 74 shows the various types of buttons found in the EPOCH 650 ultrasonic f...

Page 87: ...ng messages and notifications as needed following your actions see example in Figure 4 4 on page 75 Figure 4 4 Message bar with a message example Submenu Function menu item that opens a dialog box or...

Page 88: ...meter Press the 2ND F DELAY direct access key to select the Delay parameter Once selected the button turns green see Figure 4 5 on page 76 Turn the adjustment knob or press the Up and Down arrow keys...

Page 89: ...the icons and digital values for up to five selectable measurements see Figure 4 7 on page 77 See Reading Setup Page on page 91 for details on how to select measurements and for a description of avail...

Page 90: ...4 8 on page 78 Figure 4 8 Example of an A scan waveform with gates 4 6 Flags The EPOCH 650 ultrasonic flaw detector indicates when particular functions are active by displaying a set of flags in a th...

Page 91: ...area displaying flags Table 7 Flag description Flag Description Length units are inches Length units are millimeters Length units are microseconds Indicates that the 2ND F key has been pressed Gate 1...

Page 92: ...ate 1 is in first peak measurement mode Gate 2 is in first peak measurement mode The IF gate is in J Flank measurement mode Gate 1 is in J Flank measurement mode Gate 2 is in J Flank measurement mode...

Page 93: ...ZE is active Auto FREEZE is active PEAK MEM is active 2ND F PEAK HOLD reference echo is active Waveform averaging is active Access to all instrument functions except ON OFF is locked Indicates that a...

Page 94: ...rize similar functions It includes five menu groups shown in Figure 4 10 on page 83 Indicates that the charger is connected and charging the battery Indicates that the instrument is running off of bat...

Page 95: ...5 provides a quick reference of available menus and parameters for each menu group Table 8 Content of the first menu group Menus Parameters Basic Velocity Zero Range Delay Pulser PRF Mode PRF Energy D...

Page 96: ...etup G1 Mode G1 RF G1 Amp G2 Mode G2 RF G2 Amp G2 Tracks Table 10 Content of the third menu group Menus Parameters Display Setup Display Setup Grid Meas Setup Reading Setup Unit TH Res Res A Out Speci...

Page 97: ...setup mode data collected Re Cal inspect mode Clear setup mode data collected Setup Template Template1 inspect mode Template2 inspect mode Template3 inspect mode Template4 inspect mode Template5 insp...

Page 98: ...nding parameter The button background of the selected parameter turns to green showing that it is selected 2 Use the arrow keys or turn the adjustment knob to change the value see Parameter Adjustment...

Page 99: ...page 1 Access the setup page you want using the appropriate function and parameter 2 Press NEXT to select the field or parameter to modify 3 Use the arrow keys or turn the adjustment knob to change th...

Page 100: ...using the NEXT button and then choose Edit 3 On the virtual keyboard a Move the cursor on the character to be added by using the arrow keys or by turning the adjustment knob b Select INS F5 key 4 Repe...

Page 101: ...rs that control aspects of the display see Figure 4 13 on page 89 Figure 4 13 The Display setup page To use the Display setup page 1 Choose Display Setup group 3 5 2 Press Display Setup P1 key 3 Selec...

Page 102: ...or 110 full screen height Baseline Baseline Break Modifies the appearance of the A scan in full wave rectified mode When active the instrument locates all zero cross points in the RF waveform and pul...

Page 103: ...ature for visualization of data collection in the live A scan screen For more information on the setup and use of the Grid View feature see Grid View on page 217 4 8 4 Reading Setup Page The Reading s...

Page 104: ...n manual mode Figure 4 14 on page 91 shows an example of the measurement reading boxes and icons that indicate what type of measurement is being displayed Table 13 on page 92 presents the available me...

Page 105: ...te 1 Minimum Depth Minimum depth in gate 1 Resets on gate adjustment and on most pulser receiver adjustments Gate 2 Minimum Depth Minimum depth in gate 2 Resets on gate adjustment and on most pulser r...

Page 106: ...ge of DAC TCG curve height Gate 1 dB to Curve Amplitude measurement in gate 1 Displays echo dB value compared to curve height where the curve equals 0 dB Gate 2 dB to Curve Amplitude measurement in ga...

Page 107: ...dB Current Amp Comparison value in dB measuring the difference between the gate 1 echo height and the reference gain Gate2 Ref dB Current Amp Comparison value in dB measuring the difference between t...

Page 108: ...select the user interface language English Japanese German French Spanish Russian and Chinese Filter Group Used to select receiver filter group Key Beep Sounds an audible tone on every key press Alarm...

Page 109: ...command type for remote PC communication with the instrument Multi Char or Single Char When communication with the Olympus GageView Pro PC software Multi Character mode must be selected Communication...

Page 110: ...ion about the instrument hardware and software identification data see Figure 4 17 on page 98 Figure 4 17 The Status setup page The About page has four sub pages Battery Status Provides information ab...

Page 111: ...4 8 7 Clock Setup Page The Clock setup page shown in Figure 4 18 on page 99 allows you to configure the date and time settings for the instrument Figure 4 18 The Clock setup page To use the Clock set...

Page 112: ...Defining Licensed and Unlicensed Software Features on page 225 for details on software option activation 4 8 9 Misc Setup Page The Misc miscellaneous page allows you to perform imports and exports of...

Page 113: ...d Imports new custom DGS AVG probe library from the microSD card to internal memory see DGS AVG on page 240 for more information Copy DGS Custom Probe File to External SD Card Exports current DGS AVG...

Page 114: ...justment lists see Figure 4 20 on page 103 When using the dB gain RANGE or DELAY direct access keys a set of preset values appears over the parameter keys at the bottom of the screen These values are...

Page 115: ...ation pad or adjustment knob The Editable Parameters setup page displays all the system parameters that can be edited The page layout is similar to a spreadsheet The data is laid out in rows and colum...

Page 116: ...t knob or arrow keys to change the value of the selected parameter value 5 To erase the value of a selected parameter press Clear P1 key 4 8 11 Analog Output Setup Page The analog output setup paramet...

Page 117: ...AUTO XX Feature The AUTO XX feature was formerly known as the AUTO 80 in the EPOCH 4 Series The default setting for AUTO XX in the EPOCH 650 ultrasonic flaw detector is 80 full screen height FSH You c...

Page 118: ...g or subtracting scanning gain based on the relation to a fixed gain level To set reference gain and adjust 1 Press 2ND F REF dB The gain display reads REF XX X 0 0 dB Scanning gain can now be added o...

Page 119: ...e of how often the transducer is being pulsed by the electronic circuitry in the EPOCH 650 ultrasonic flaw detector PRF is typically adjusted based on the test method or test piece geometry For parts...

Page 120: ...in the EPOCH 650 is always equal to the PRF rate unless you are using a multiplexer 5 4 2 Pulse Energy Voltage The EPOCH 650 ultrasonic flaw detector can adjust the pulse energy from 0 V to 400 V in...

Page 121: ...ansducer being used the various damping settings either improve near surface resolution or improve the instrument s penetration power 5 4 4 Test Mode The EPOCH 650 ultrasonic flaw detector can operate...

Page 122: ...t using the Pulser parameter of the Pulser mode Spike Used to mimic a traditional spike pulse by using a narrow width pulse to excite the transducer Square Used to tune the width of the pulse to optim...

Page 123: ...Receiver Adjustments The receiver settings are accessed from the Rcvr menu The receiver parameters are Digital Receiver Filters Waveform Rectification 5 5 1 Digital Receiver Filters The has a total i...

Page 124: ...e 112 To select either the Standard or Advanced filter sets 1 Choose Instr Setup General group 3 5 2 Press NEXT to select Filter Group 3 Select Standard or Advanced To adjust the Filter Choose Rcvr Fi...

Page 125: ...r can operate in one of four different rectification modes that you can select using the Rcvr Rect parameter Full Half Half or RF unrectified The RF mode is not active while operating in special softw...

Page 126: ...DMTA 10055 01EN Rev A February 2015 Chapter 5 114...

Page 127: ...s you to eliminate unwanted low level signals from the display The reject function is linear and adjustable from 0 to 80 FSH Increasing the reject level does not affect the amplitude of the signals ab...

Page 128: ...tude of each A scan acquisition The display updates each pixel if a signal of greater amplitude is acquired When you scan the transducer over a reflector the signal envelope echo dynamic as a function...

Page 129: ...am inspection The peak memory function cannot be activated in the unrectified Rcvr Rect RF mode To activate peak memory function 1 Press PEAK MEM The symbol appears in the flag area to indicate that t...

Page 130: ...en and still allows viewing of the live waveform The symbol appears on the right side of the A scan display indicating that the function is active 3 Press 2ND F PEAK HOLD again to shut off the peak ho...

Page 131: ...ea s of interest to obtain measurement data Gain To amplify signals of interest or to reduce the amplitude of signals when high scanning gain values are being used Range and delay To manipulate the ti...

Page 132: ...ay Setup Display Setup to open the Display setup menu 2 Press NEXT to move the focus to the X Axis Grid Mode parameter see Figure 6 3 on page 120 Figure 6 3 Selecting the x axis grid mode 3 Use the ad...

Page 133: ...splaying actual sound path measurements at equally spaced increments along the horizontal axis This mode displays 5 divisions each labeled with its corresponding sound path value depending on the Basi...

Page 134: ...ied mode When Baseline Break is active the instrument identifies all zero cross points as lines connecting individual A scan lobes to the baseline on the display This feature can help to visually sepa...

Page 135: ...e A scan a gate is represented by an horizontal line with fixed start and end points The length and horizontal position of the line identifies the sound path range while the vertical position of the g...

Page 136: ...depth alarms The gates can also be used together to take echo to echo thickness measurements You can control the gates using the parameters in the Gate 1 and Gate 2 menus see Figure 7 2 on page 124 F...

Page 137: ...of the gate 7 2 Quickly Adjusting Basic Gate Parameters You can perform basic gate adjustments using the GATES direct access key To quickly adjust the position of a gate 1 Press the GATES direct acce...

Page 138: ...nt mode When adjusting a gate using the direct access GATES key the parameter key menu along the bottom of the screen disappears and Gates becomes the active parameter To return to the previously sele...

Page 139: ...using the following modes Edge Acquires measurement readings based on the position of the first crossing point of a gated signal The indication must break the threshold of the gate for a measurement t...

Page 140: ...asurement readings based on the position of the first crossing point of a gated signal and amplitude measurement readings from the highest peak of the first echo in the gated region see Figure 7 6 on...

Page 141: ...Position and width are identical and the gate level mirrors across the X axis example 25 and 25 Positive The gate appears only on the positive side of the x axis Negative The gate appears only on the...

Page 142: ...terest falls within the gated region per the measurement mode definitions above 7 4 Viewing Measurement Readings The EPOCH 650 ultrasonic flaw detector provides five measurement reading boxes to displ...

Page 143: ...and gate 2 1 Activate both gates by selecting Gate 1 Status On and Gate 2 Status On 2 As shown in the example of Figure 7 7 on page 131 position gate 1 over the first echo to detect and then position...

Page 144: ...f flight mode Select Meas Setup Unit s In time of flight mode all distance measurements are displayed in microsecond values instead of inches or millimeters 7 7 Zooming on a Gate The EPOCH 650 ultraso...

Page 145: ...are positive threshold negative threshold and minimum depth When an alarm condition is triggered on a particular gate the corresponding alarm output pin on the Digital Out connector provides a 5V TTL...

Page 146: ...ultrasonic flaw detector is equipped with a minimum depth alarm that is triggered whenever the current thickness measurement reading falls below an operator defined level The minimum depth alarm can b...

Page 147: ...able when certain special functions are enabled 7 8 4 Minimum Depth Alarm with Gate Tracking The EPOCH 650 ultrasonic flaw detector can use the minimum depth alarm when making echo to echo thickness m...

Page 148: ...DMTA 10055 01EN Rev A February 2015 Chapter 7 136...

Page 149: ...alarm condition for each gate The three gate alarms that can be set are positive threshold negative threshold and minimum depth see Gate Alarms on page 133 When a gate alarm is triggered the correspon...

Page 150: ...This mode allows an external device to control the pulse timing and frequency of the EPOCH 650 via the RXD pin located on the Digital Out connector see EPOCH 650 15 pin digital port output on page 305...

Page 151: ...ernal device such as a strip chart recorder or a computer outfitted with an analog digital converter card The information is output as a scaled voltage on either a 0 1 V or 0 10 V scale The EPOCH 650...

Page 152: ...lue for the impedance of the peripheral device measuring the analog output of the EPOCH 650 instrument Matching the impedance of the output from the EPOCH 650 with the impedance of the input to the pe...

Page 153: ...DMTA 10055 01EN Rev A February 2015 Programmable Inputs and Outputs 141 Figure 8 1 The A Out setup page...

Page 154: ...DMTA 10055 01EN Rev A February 2015 Chapter 8 142...

Page 155: ...calibration that provides for a fast and easy calibration process This section details the procedures to calibrate the EPOCH 650 using the four basic transducer configurations straight beam delay line...

Page 156: ...0 000 in 8 Choose Rcvr Reject group 1 5 and then set the reject level to 0 9 Select Gate 1 Status group 2 5 and set it to On to activate gate 1 10 Couple the transducer to the block and then adjust t...

Page 157: ...means that you must only calibrate for the material velocity of the sample to acquire accurate echo to echo measurements You can perform echo to echo measurements between G2 G1 and this calibration mo...

Page 158: ...is used The steps measure 0 100 in 0 200 in 0 300 in 0 400 in and 0 500 in If the EPOCH 650 is set to work in metric units the calibration process is exactly the same except that the entries are in mi...

Page 159: ...litude to XX of full screen height the default XX value is 80 To activate this feature press 2ND F AUTO XX A thickness measurement reading appears in large text above the A scan see Figure 9 1 on page...

Page 160: ...hickness of the gated indication 0 200 in in this example and then press Continue P3 key to continue to the second calibration step see Figure 9 3 on page 149 The thickness value used in this part of...

Page 161: ...se the GATES key to position gate 1 so that the first back wall echo from the known thickness step exceeds the gate threshold 11 Press dB to adjust the gain setting so that the echo amplitude is at ap...

Page 162: ...one known thickness In this scenario leave the transducer coupled on the unique thickness move the gate over to one of the multiple back wall echoes and then enter the correct sound path thickness the...

Page 163: ...initial setup procedure outlined in Basic Setup on page 143 2 Connect the transducer to an appropriate cable and then connect the cable to either of the transducer connectors at the top of the instrum...

Page 164: ...on P5 key to position gate 1 so that the first back wall echo from the known thickness step exceeds the gate threshold 9 Press dB and then adjust the gain value so that the echo amplitude is at approx...

Page 165: ...for zero calibration Ensure that it is the first back wall echo being gated not a multiple echo from the end of the delay line tip 10 Once a steady reading is achieved choose Auto cal Cal Zero The scr...

Page 166: ...ess of the gated indication 0 100 in in this example and then press Continue P3 key to continue to the second calibration step see Figure 9 8 on page 155 The thickness value used in this part of the c...

Page 167: ...m the known thickness step exceeds the gate threshold 14 Press dB and then adjust the gain value so that the echo amplitude is at approximately 80 A thickness measurement reading appears in large text...

Page 168: ...nd a thick step In this scenario leave the transducer coupled on the thin step move the gate over to one of the multiple back wall echoes and then enter the correct sound path thickness 2 3 4 etc mult...

Page 169: ...rrection possibly causing some nonlinearity within the calibrated range The amount of nonlinearity depends on the minimum thickness used in the calibration process The zero offset value of dual elemen...

Page 170: ...ing edge only 8 Use the G1Start button P5 key to position gate 1 so that the leading edge of the first back wall echo from the known thickness step exceeds the gate threshold 9 Press dB and adjust the...

Page 171: ...e to match the known thickness of the gated indication 0 100 in in this example and then choose Continue to continue to the second calibration step The thickness value used in this part of the calibra...

Page 172: ...gate 1 so that the first back wall echo from the known thickness step exceeds the gate threshold Adjust the gain so that the echo amplitude is at approximately 80 14 Once a steady reading is achieved...

Page 173: ...asurement is very close to the expected thickness of the material to be inspected Echo to echo mode measures the distance between two actual indications one representing the measurement start point an...

Page 174: ...tapping your finger on the end of the couplant coated delay line This dampens the signal and the echo should jump up and down on the screen 5 Choose Basic Zero and then increase the value to move thi...

Page 175: ...t be impossible to bring the second indication above 50 while avoiding saturation of the first signal If this is true try using the Edge detection mode instead of the peak detection to ensure accurate...

Page 176: ...al Vel box appears see Figure 9 15 on page 164 Figure 9 15 Entering the Velocity Cal thickness value 14 Adjust the value to match the known thickness of the gated indication 0 300 in in this example a...

Page 177: ...instrument 3 Choose Trig Angle and then enter the correct refracted angle for the transducer wedge combination 45 for this example 4 Choose Basic Velocity and then enter the approximate shear wave vel...

Page 178: ...be forward and backward to bring the echo to its maximum amplitude peak 4 Ensure the echoes do not exceed 100 If necessary reduce the gain The peak memory is an excellent tool for finding the BIP Pres...

Page 179: ...the Refracted Angle The expected refracted angle of the probe should already have been entered in the EPOCH 650 in the initial steps of the calibration procedure Although the wedge may be marked 45 fo...

Page 180: ...use the Peak Memory feature to help find the peak of the signal 3 Hold the probe stationary once the signal amplitude reaches a maximum and then note the degree mark on the block that is aligned with...

Page 181: ...e Olympus IIW Type I carbon steel calibration block part number TB7541 1 For information on distance calibration with other standard calibration blocks see Common Angle Beam Calibration Block Diagrams...

Page 182: ...rom the arc of the block is exceeding the gate threshold This reflection should be close to 100 mm 4 in 4 Press dB and then adjust the gain setting so that the echo amplitude is at approximately 80 Th...

Page 183: ...ch the known thickness of the gated indication 4 000 in in this example and then choose Continue to continue to the second calibration step If for any reason you need to exit without acquiring calibra...

Page 184: ...ually the result of beam spreading and sound bouncing off the side of the block Ensure that gate 1 is not over this echo 8 Press dB and then adjust the gain so that the echo amplitude is at approximat...

Page 185: ...ess Done to complete the calibration process 9 8 4 Calibrating for Sensitivity The final step in the angle beam calibration is to calibrate for sensitivity This allows you to set up a reference gain l...

Page 186: ...zed adjust the system sensitivity gain to bring the reference reflector signal to a predetermined reference line on the screen In this example the echo is brought to 80 of full screen height 4 Press 2...

Page 187: ...orm a sensitivity calibration It is of particular importance to verify the refracted angle before performing a distance calibration The acquired depth measurement s used in this mode of calibration ar...

Page 188: ...mm 2 75 in For this sample calibration the side drilled holes at depth 12 5 mm and 38 mm 0 5 in and 1 5 in are used For information on distance calibration with other standard calibration blocks see C...

Page 189: ...bration 5 Press dB and then adjust the gain so that the echo amplitude is at approximately 80 The AUTO XX feature can be used to automatically adjust the gain to set the gated echo amplitude to XX of...

Page 190: ...kness value 7 Adjust the value to match the known thickness of the gated indication 0 500 in in this example and then choose Continue to continue to the second calibration step see Figure 9 28 on page...

Page 191: ...ole is within the gated region This reflection should be close to 38 1 mm 1 5 in 9 Press dB and adjust the gain so that the echo amplitude is at approximately 80 A thickness measurement reading appear...

Page 192: ...f the test piece is curved in the direction of the sound path of the transducer This feature corrects the horizontal distance and depth to reflector measurements based on part thickness and part diame...

Page 193: ...Thick and then enter the wall thickness of the inspection piece 9 11 Common Angle Beam Calibration Block Diagrams Figure 9 30 on page 181 to Figure 9 36 on page 186 illustrate calibration blocks comm...

Page 194: ...DMTA 10055 01EN Rev A February 2015 Chapter 9 182 Figure 9 31 The IIW type 2 reference block P N TB5939 1 0 060 HOLE 906 LUCITE 2 DIA LUCITE PLUG 0 046 THRU 0 078 THRU 0 125 THRU 3 8 RAD...

Page 195: ...alibration 183 Figure 9 32 The distance and sensitivity calibration DSC test block P N TB7549 1 1 in 2 54 cm 5 in 12 7 cm 17 78 cm 7 i n 7 62 cm 3 in R2 625 REF R3 000 REF 2 500 REF 032 REF R1 000 REF...

Page 196: ...Rev A February 2015 Chapter 9 184 Figure 9 33 The ASTM E164 IIW type metric calibration block P N TB1054 2 100 mm 225 mm 300 MM REF NO LUCITE PLUG 100 MM REF R100 MM REF 200 MM REF 25 MM REF 91 MM RE...

Page 197: ...Calibration 185 Figure 9 34 The ISO 7963 MAB calibration block P N TB1065 1 Figure 9 35 The Navships cylindrical reflector block P N TB7567 1 25 MM REF 30 0 REF R25 MM REF R 50 MM REF 75 MM REF 5 MM T...

Page 198: ...DMTA 10055 01EN Rev A February 2015 Chapter 9 186 Figure 9 36 The 5 step precision thickness calibration block P N 2214E 3 75 REF 75 TYP...

Page 199: ...es rename files clear file contents and delete files On screen review of all file contents including snapshot and grid view File summary screen without images and setup info for measurement review to...

Page 200: ...re created for the different transducers materials or test parts being used The advantage to storing setup data in calibration files is that the data can be quickly recalled to the live screen using t...

Page 201: ...refers to the last column and last row is reached 10 1 3 4 2 D EPRI The 2 D EPRI file 2DEPR is the same as the standard 2 D grid file type except for a minor change in the way alpha characters increme...

Page 202: ...d to precisely identify the exact location of each thickness reading 10 2 Data Logger Storage Capacity The EPOCH 650 ultrasonic flaw detector data logger can store over 100000 IDs on 2 GB of available...

Page 203: ...eform if active Complete setup parameters Flag status FREEZE zoom PEAK MEM etc Active software features DAC TCG DGS AVG AWS D1 1 D1 5 Software feature option setups 10 4 Data Logger Menus The data log...

Page 204: ...can be created on the instrument or in the GageView Pro software and transferred to the instrument Each time you save file data it is linked to a file identifier ID The number of IDs in a file depends...

Page 205: ...re 10 2 The Create setup page 2 In the Create setup page use the arrow keys or adjustment knob to select the file type INC or CAL 3 Press NEXT to highlight the Filename field 4 Press Edit P1 key and t...

Page 206: ...te press NEXT then Edit P1 key to enter information 6 If the File Type is INC a Press NEXT then Edit P1 key to enter an optional ID Prefix This prefix will save as part of the ID but will not incremen...

Page 207: ...This is a separate function from Create See Selecting a File as the Active Storage Location on page 197 for instructions on how to open a file To create Advanced files 1 Choose File Create group 5 5 t...

Page 208: ...ress a parameter key P1 P7 to select a type see Figure 10 5 on page 196 SEQ SEQ CP 2D 2DEPR 2D CP 3D BOILER 8 Enter the required and optional if desired information for the selected type 9 Press NEXT...

Page 209: ...ibed in detail below Selecting a File as the Active Storage Location The EPOCH 650 maintains a list of all files that have been created or downloaded to the instrument To save information to a file yo...

Page 210: ...n page 198 When you press 2ND F SAVE from the live screen on screen data and settings are saved to the currently open ID Figure 10 7 ID of open file in the live screen Viewing file setup information Y...

Page 211: ...a file you are able to view contents of the saved data The waveform and basic setup parameters are stored on one screen and the complete setup information on another screen To view saved data 1 Choose...

Page 212: ...DMTA 10055 01EN Rev A February 2015 Chapter 10 200 Figure 10 9 Viewing file content waveform 3 Press Setup to view the complete setup parameters for the current ID see Figure 10 10 on page 201...

Page 213: ...rn to the File Open menu To choose from a large number of IDs 1 Choose File Open 2 Use the knob or arrow keys to select the specific file that you want to view 3 Press Contents P3 key 4 Press Select I...

Page 214: ...ect the specific file that you want to view 2 Press Contents P3 key to view the saved waveform and basic setup data The ID being viewed shows up at the top of the screen 3 Press Select ID P2 key to di...

Page 215: ...view a summary of all saved data in a file 1 Choose File Open group 5 5 and select the file you want to view 2 Press Summary P3 key to view a measurement summary for all the saved IDs in the selected...

Page 216: ...yed in the quick recall setup window To quickly recall a file using the recall setup 1 Select File Quick Recall group 5 5 The Recall setup menu appears see Figure 9 11 on page 159 Figure 10 13 The Rec...

Page 217: ...be entered from the live screen To add a memo to a particular data file open that file before creating the memo To place a memo in the database with a particular reading enter it before saving the rea...

Page 218: ...Memo Dictionary page 5 Press INS P2 key to insert the custom label into the memo and return to Memo setup page one see Figure 10 15 on page 206 6 Press Edit to add more information to the selected fie...

Page 219: ...0 4 1 5 Last ID and Select ID When a file is opened it defaults to the first open ID displayed in the ID field at the top of the screen To select the last ID in the file Choose File Last ID To select...

Page 220: ...DMTA 10055 01EN Rev A February 2015 Chapter 10 208 Figure 10 17 The Select ID menu 10 4 2 Manage Menu This section presents the Manage menu see Figure 10 18 on page 209...

Page 221: ...rs The parameters are as follows Reset Export Import Edit Copy Delete Import Memo 10 4 2 1 Reset The EPOCH 650 ultrasonic flaw detector allows you to reset its current settings to default values when...

Page 222: ...sed on or between EPOCH models xml a format that is useful for using in web applications bmp an image format that can be opened in any image viewing software To export file data to the microSD card 1...

Page 223: ...from the external microSD Card To import file data from the microSD card 1 Choose Import P3 key to display the Import page see Figure 10 20 on page 212 2 Use the arrow keys or adjustment knob to selec...

Page 224: ...To import memo data from the microSD card 1 Press Import Memo P7 key to display the Import page see Figure 10 21 on page 213 2 Use the arrow keys or adjustment knob to select the file that you want to...

Page 225: ...Figure 10 21 Import memo page 10 4 2 4 Edit The Edit parameter is used to edit file names and descriptions once a file has been saved To edit file creation parameters 1 Choose Manage Edit group 5 5 to...

Page 226: ...ighlight the field you want to edit 4 Press Edit P1 key to add or change information in the field 5 Press NEXT to select Apply 6 Press Ok to confirm the changes 7 Press to return to the main screen 10...

Page 227: ...ame rules mentioned previously for file names apply to this field 4 Select Copy and press Ok to confirm the changes Press to return to the main screen 10 4 2 6 Delete The Delete function is used to de...

Page 228: ...before you continue 4 Press Clear P3 key to clear the contents of a file 5 Press Delete P6 key to erase the selected file from the instrument 10 4 2 7 Import Memo Imports the memo fields from a file o...

Page 229: ...5 1 Activating Grid View Grid View must be activated before it is visible on the screen To activate Grid View 1 Navigate to the Display Setup group menu 3 5 2 Press Grid Setup P2 key to enter the Grid...

Page 230: ...nd display the grid 10 5 3 Using the Grid Since Grid View displays the data contained in a file there are two ways you can view this data Adding data to a file from the live screen while making measur...

Page 231: ...erwrite data in a live screen 1 Use the Up and Down arrow buttons to navigate to the cell to overwrite see To use the arrow buttons on page 220 2 Make a measurement 3 Press Save P7 key A dialog box po...

Page 232: ...ID to the new highlighted cell 2 Use the Right arrow button P2 key to move the focus to the right of the highlighted cell and change the active file ID to the new highlighted cell 3 Use the Up arrow b...

Page 233: ...PC card reader adaptors for this purpose are included with the instrument The saved screen shots are titled BMP0 bmp BMP1 bmp BMP2 bmp etc as each screen shot is saved 10 7 Video Record The video reco...

Page 234: ...ional fields 4 Press NEXT to highlight the Create button then press Ok P1 key To clear video from memory Press Clear P4 key to clear the current video recording from internal memory The Record counter...

Page 235: ...tment knob or arrow keys to select a file 3 Press Import P3 key to import the file from the microSD card 4 Press to return to the live screen and video recorder controls To delete a recording 1 Choose...

Page 236: ...DMTA 10055 01EN Rev A February 2015 Chapter 10 224...

Page 237: ...ilable These options are not standard inclusions of the base instrument and must be purchased and added to the unit These options Template Storage API 5UE Waveform Averaging Interface Gate Corrosion M...

Page 238: ...Setup Software Options 6 Press Edit P1 key to activate the virtual keypad 7 Enter the activation code in the Enter Option Key field see Figure 11 1 on page 226 8 Press NEXT to select Activate 9 Press...

Page 239: ...h techniques during a single inspection When you switch from DAC to TCG view the DAC curves are displayed as TCG lines across the screen The time varied gain effectively amplifies the signals across t...

Page 240: ...the live echo peaks or the DAC curve while providing the amplitude or dB comparison of the actual peak to curve ratio In this way you can use scanning gain while maintaining an accurate measurement re...

Page 241: ...rs The ASME III or ASME 3 mode draws three DAC curves one main curve from peak to peak on the reference reflectors and two warning curves at 6 dB and 14 dB compared to the main curve To set up ASME 3...

Page 242: ...acquired 5 Move the probe to the next echo and center gate 1 over the echo You can adjust the RANGE and DELAY while detecting the echo You can also go to the Trig menu item and adjust the Angle Thick...

Page 243: ...80 full screen height This assures that the point is captured accurately because amplitude resolution is better at greater echo heights This also pushes the first captured echo over 110 FSH so the mai...

Page 244: ...ode Figure 11 6 The completed DAC curve Once the DAC curve is complete and the instrument is in inspection mode the instrument provides a new set of parameters DAC Gain This adjustment allows you to m...

Page 245: ...dB G1Start The start position of Gate 1 is also adjustable through the DAC menu as well as by pressing the GATES key Edit This parameter allows you to return to DAC acquisition mode providing access t...

Page 246: ...ing Gain In order to quickly find and identify potential defects it is commonly required by code to increase the gain scanning gain on the EPOCH 650 from the reference calibration gain for scanning pu...

Page 247: ...AC setup with 3 dB of scanning gain added Figure 11 9 Standard DAC with 3 dB scanning gain When reference correction is active the digital comparison between a captured reflector and the DAC curve is...

Page 248: ...hin a part it is necessary to raise the gain of both the live A scan and the DAC curve to continue the inspection This is accomplished on the EPOCH 650 using the curve gain DAC curve adjustment gain T...

Page 249: ...cause signal loss after calibrating a DAC curve which results in inaccurate comparisons of the test reflectors with the calibrated DAC curve The EPOCH 650 can be easily adjusted for this potential di...

Page 250: ...urve setup that allows you to define up to six additional reference curves from the primary curve at varying levels from 24 dB to 24 dB The Custom DAC Curves option is ideal for unique sizing inspecti...

Page 251: ...oftware Features and Options 239 Figure 11 12 Custom DAC setup The custom DAC setup and functionality are the same as the Standard and ASME III discussed earlier in this section Figure 11 13 on page 2...

Page 252: ...Custom DAC curve also incorporates the reference correction functionality if desired 11 3 DGS AVG The Onboard DGS AVG option in the EPOCH 650 ultrasonic flaw detector permits complete DGS AVG setups t...

Page 253: ...stics in the GageView Pro computer interface program and download them to the EPOCH 650 Probes that are downloaded to the instrument appear in the custom transducers section of the transducer library...

Page 254: ...t can be made from this setup page DGS AVG Activate Deactivate the DGS AVG function Probe Type Selects the type of probe to be used Straight Beam Angle Beam or Dual Probe Probe Name Selects the actual...

Page 255: ...ndition from the calibration block to the test piece EN 583 2 2001 provides methods for calculating transfer correction Reg Level The height of the main DGS AVG curve The curve represents the amplitud...

Page 256: ...therefore affect the accuracy of defect sizing A suggested method for the measurement of relative attenuation can be found later in this manual 2 Once you have completed the selections in the DGS AVG...

Page 257: ...ions 245 Figure 11 15 Reference reflector before capture After capturing the reference reflector the EPOCH 650 automatically calculates the DGS AVG curve s and displays them at the correct registratio...

Page 258: ...setting during calibration of the instrument It is typically added when the surface conditions between a calibration block and test piece are different The coupling conditions on the test surface can...

Page 259: ...eyond a certain depth sound path time within a part it is necessary to raise the gain of both the live A scan and the DGS AVG curve to continue the inspection This is accomplished on the EPOCH 650 usi...

Page 260: ...the critical flaw size for the application The EPOCH 650 allows you to adjust this registration level during a live inspection This curve height adjustment is possible because the DGS AVG curves are...

Page 261: ...ctive Perhaps there are more suitable methods available You must decide the most appropriate method to arrive at the values for ACV Specimen and ACV Cal Block based on the application and local requir...

Page 262: ...ure is that of simplifying inspector tasks and lowering the overall inspection time The EPOCH 650 does this by automatically performing required calculations It also by permits the inspector to docume...

Page 263: ...1 4 2 Adjusting the AWS Reference Level The EPOCH 650 ultrasonic flaw detector allows you to define the reference level to adhere to best practices and procedures The reference reflector is often a si...

Page 264: ...to reference height 3 Choose AWS Ref B to store the gated reflector as the Ref B value and choose YES to confirm see Figure 11 19 on page 252 Figure 11 19 Reference B value before storage Once the Re...

Page 265: ...in the test piece than the reference flaw To add scanning gain 1 Use the dB key to adjust the scanning gain value necessary to perform the inspection as outlined by the AWS Code 2 Press Scan dB P2 key...

Page 266: ...the bottom of an ID saved with AWS D1 1 active you can see the values for A B C and D This data can be viewed in the file review window You can also choose to see live A B and C values displayed in t...

Page 267: ...osition is noted as T1 The transducer is then moved away from the crack until the signal has dropped 6 dB on the other side of Amax This position is noted as T2 Using these measurements along with a k...

Page 268: ...been licensed on the instrument it can be activated at any time during standard operation To activate the API 5UE software option 1 Select API5UE Setup 2 In the API5UE menu select API5UE On see Figur...

Page 269: ...ing a reference notch of known depth in certain circumstances a through drilled hole is desirable for calibration see the full text of the API Recommended Practice 5UE for details concerning reference...

Page 270: ...Memory function To calibrate in Envelope mode 1 Press PEAK MEM to activate the Peak Memory function The letter P appears to the right of the live A Scan display see Figure 11 23 on page 259 2 Find the...

Page 271: ...tomatically collects Amax T1 and T2 and calculates a k factor from the known reference height dr These three collected values Amax T1 and T2 are displayed on the screen in their respective positions u...

Page 272: ...e the Peak Memory function 2 Find the signal from the potential defect and bring to maximum amplitude see API s Recommended Practice 5UE for crack scanning and inspection requirements 3 If necessary p...

Page 273: ...e You can also use the Manual mode approach with the API 5UE option This mode allows you to manually select the Amax T1 and T2 points from a live A Scan to obtain a crack depth indication With the Pea...

Page 274: ...5 Storing the Amax point 7 Move the transducer forward over the notch until the peak drops to 40 FSH on the leading edge of the signal 8 Press RefT1 P2 to collect the 6 dB drop position of the leading...

Page 275: ...g the T1 point 9 Move the transducer backward over the notch until the peak drops rises to 80 and then falls back to 40 FSH on the trailing edge of the signal 10 Press RefT2 P3 to collect the 6 dB dro...

Page 276: ...Crack Sizing Once the API 5UE software has been properly calibrated to a reference notch use the following steps to size a crack using Manual mode To size a crack using Manual mode 1 Find the signal...

Page 277: ...above to inspect again At any time during an inspection in either Envelope mode or Manual mode it is possible to re calibrate the instrument Press the RE CAL function key F5 to enter the calibration...

Page 278: ...Averaging software feature 1 Select Meas Setup Special group 3 5 The Special screen appears see Figure 11 28 on page 266 2 In the Special menu select Average 3 Select the level of averaging 4 Press to...

Page 279: ...al to the PRF as it is in standard mode The effective measurement rate when using the averaging option is equal to the total PRF divided by the averaging factor At higher averaging rates the screen up...

Page 280: ...monly used with two specific forms of inspections The first is an inspection where potential defects may not be oriented parallel to the direction of sound from the transducer Sound will still reflect...

Page 281: ...rom material grain structure The BEA is used to display the entire back wall signal on the screen so that it can be closely monitored Both inspection forms are useful when detecting very small defects...

Page 282: ...and alarms under gate 2 are based on the attenuated echo To adjust back wall gain 1 Press BEA Gain P6 key 2 Manually adjust the gain or press 2ND F AUTO XX to automatically adjust the echo in the BEA...

Page 283: ...The interface gate is also commonly used with captive water column transducers 11 8 1 Activating the Interface Gate When the interface gate option is enabled the GateIF and GateIF Setup submenus becom...

Page 284: ...To set the material velocity 1 Navigate to the GateIF Setup menu item group 2 5 2 Press Velocity P7 key 3 Use the adjustment knob or arrow keys to set the required velocity see Figure 11 33 on page 27...

Page 285: ...allows more stable visibility to the test material reflection positions regardless of interface variation Note that the indication being tracked by the interface gate is determined by the gate measur...

Page 286: ...rly set up it will track to the position of the reflection in the interface gate Figure 11 35 on page 274 shows an example of the interface gate and TCG when used together The TCG is indicated by the...

Page 287: ...peration Once the appropriate preset dual transducer is selected the Corrosion Module automatically adjusts the pulser and receiver settings to optimize the ultrasonic setup Measurement thresholds and...

Page 288: ...ndard probe library Dual transducers are typically constructed with a small angle of incidence in both the transmit and receive crystals This small angle is known as the roof angle Because of the roof...

Page 289: ...ent indicator is located at the bottom of the A scan window to show more accurately where the zero cross measurement is being acquired Figure 11 36 Corrosion Module screen A common visual tool used in...

Page 290: ...you will use during your inspection When a transducer is selected key parameters for the selected transducer are loaded with default values These values are shown on the right side of the Transducer...

Page 291: ...transducer is critical for proper operation of the Corrosion Module Figure 11 38 Corrosion Module transducer Setup menu 3 Press to continue 4 Follow the prompt to wipe the couplant off the probe then...

Page 292: ...cy Common adjustments in the basic Corrosion Module measurement mode include Rectification Extended Blank Control Manual Gain Adjustment 11 9 4 1 Rectification All rectification views are available in...

Page 293: ...ensation AGC is recommended when measuring in the Corrosion Module some applications may require manual adjustment of gain to achieve optimal results Often this requirement is related to transducer se...

Page 294: ...knob or arrow keys to set AGC to Off see Figure 11 40 on page 282 Figure 11 40 Corrosion Module AGC set to Off 3 Press dB and press a parameter key P1 P7 to set a gain range then use the knob or arro...

Page 295: ...Echo Measurements The Echo to Echo function measures the distance between an echo in Gate 2 and an echo in Gate 1 In some limited applications you may want to measure the thickness of a material usin...

Page 296: ...itude values Figure 11 42 Corrosion Module echo measurement As a result of the roof angle of dual transducers often a shear wave is also produced in the inspection material when using a dual probe She...

Page 297: ...the knob or arrow keys to increase the gate 2 start position until the shear component is no longer measured 11 9 7 B Scan The B scan feature allows you to collect a single value B scan from measurem...

Page 298: ...er and records location information as data is collected in either the forward or backward direction as if data is collected in one direction only Manual Timed Mode This mode does not record location...

Page 299: ...oder Mode Bi Directional Uni Directional Manual Sets the method of B scan acquisition to either Bi Directional Uni Directional or Manual timed Scan Display Size Half Size Full Size Selects the live sc...

Page 300: ...ets the interval of successive measurements encoded B scan only The reading resolution can be changed in the following increments 0 13 mm 0 005 in Takes a reading every 1 pulse 0 26 mm 0 010 in Takes...

Page 301: ...control to start or stop the acquisition of your B scan image In Bi Directional or Uni Directional Encoder Modes acquisition of the B scan does not begin until the attached encoder is moved In Timed...

Page 302: ...ions During B scan acquisition a blue indicator appears at the bottom of the B scan window see Figure 11 46 on page 290 This blue arrow indicates the B scan position associated with the minimum thickn...

Page 303: ...ve the parameter keys P4 P7 when a B scan file is active see Figure 11 47 on page 291 Left arrow P4 key Moves the vertical cursor one 1 increment to the left for review of individual B scan data point...

Page 304: ...fferent applications to compare known conditions to unknown samples To activate template storage 1 Choose the Template menu item group 4 5 2 Press Setup P7 key to display the Template setup page see F...

Page 305: ...ress the right arrow P6 key to open the Template page 2 Select a template name then press Store P2 key 3 Press to return to the live screen The template name is displayed with the symbol A below the n...

Page 306: ...re 11 49 A indicates an active template To display a stored template Press one of the parameter keys P1 P5 that appears with a symbol below the template name see Figure 11 50 on page 295 OR 1 Press th...

Page 307: ...the Template setup page see Figure 11 51 on page 296 2 Press NEXT until Template Names is highlighted then use the adjustment knob or arrow keys to select a template 3 Use MoveUp P1 key or MoveDown P...

Page 308: ...the live A scan display 1 Choose Display Setup Display Setup to display the Display setup page 2 In the Live A Scan Display field Select Outline to display the live A scan as an outline and the templ...

Page 309: ...off the EPOCH 650 and disconnect DC power 2 Fully unfold the pipe stand at the back of the instrument see Figure 12 1 on page 298 3 Loosen the two thumb screws securing the battery compartment cover a...

Page 310: ...ontains seals that are used to protect the instrument s internal hardware from the environment These include Battery compartment cover seal Side door seal Membrane vent Main o ring seals between the t...

Page 311: ...ed to the upper half of the instrument case to fully seal the instrument If the display window is damaged the entire upper half of the instrument case and the direct access keypad must be replaced 12...

Page 312: ...keys Solution Turn the instrument power Off and On to unlock the keys Symptom The instrument does not start when pressing the On Off power key following a software update Possible cause Interrupted i...

Page 313: ...al Japanese Chinese Languages English Spanish French German Italian Japanese Chinese Russian Portuguese Transducer connections BNC or LEMO 01 Data storage Onboard up to 100 000 IDs with waveform stand...

Page 314: ...vigation pad configuration Explosive atmosphere MIL STD 810F Procedure 1 NFPA 70E Section 500 Class 1 Div 2 Group D Shock tested IEC 60068 2 27 60 g 6 s H S multiple axes 18 total Vibration tested Sin...

Page 315: ...r settings 30 digital filter sets standard Seven EN12668 1 2010 compliant filters 0 2 10 MHz 2 0 21 5 MHz 8 0 26 5 MHz 0 5 4 MHz 0 2 1 2 MHz 1 5 8 5 MHz 5 15 MHz Rectification Fullwave positive halfwa...

Page 316: ...rms Positive and negative threshold minimum depth gate 1 and gate 2 Table 21 Measurement specifications Parameter Value Measurement display locations 5 locations available manual or auto selection Gat...

Page 317: ...t standard RS 232 Yes Analog outputs 1 analog output selectable 1 V 10 V full scale 4 mA max optional Alarm outputs 3 alarm outputs 5 V TTL 10 mA Trigger I O Trigger input 5V TTL Trigger output 5V TTL...

Page 318: ...A output configuration Pin Signal Description 1 VGA_RED VGA red output 2 VGA_GREEN VGA green output 3 VGA_BLUE VGA blue output 4 NC Not connected 5 GND Ground 6 GND Ground 7 GND Ground 8 GND Ground 9...

Page 319: ...emperature For maximum accuracy establish the sound velocity in a given material by first testing a sample of the material Table 25 Ultrasonic velocities in a variety of common materials Material V in...

Page 320: ...rand Co 1958 5 Papadakis E P Panametrics unpublished notes 1972 Nickel pure 0 222 5630 Polyamide slow 0 087 2200 Nylon fast 0 102 2600 Polyethylene high density HDPE 0 097 2460 Polyethylene low densit...

Page 321: ...the live screen using the Quick Recall parameter B 2 Incremental file type Incremental INC files are designed for general inspection data storage and can contain more than one ID for storing file dat...

Page 322: ...reading is saved an error beep sounds and the momentary message Cannot Increment ID is shown on the display above the function keys Subsequent saves overwrite measurement readings if you do not manual...

Page 323: ...Types 311 Example of automatically generated incremented ID number series 1 Initial 1 2 3 Limit 9 2 Initial ABC ABD ABE ABZ ACA ACB Limit ZZZ 3 Initial ABC 12 34 ABC 12 35 ABC 12 36 Limit ABC 12 99 4...

Page 324: ...IDs which are designed for use in many corrosion applications B 3 1 Sequential A sequential SEQ file is defined by a starting and an ending ID number The resulting file includes the starting and endi...

Page 325: ...ustom points is 19 The following example describes measurements along a pipe or tube where at each ID number location you can take a measurement at the top bottom left and right of the pipe see Table...

Page 326: ...ncreases from its first to its next value This continues until the ID number that refers to the last column and last row is reached Either the columns or the rows can be selected to increment first se...

Page 327: ...ne grid for 75 identical parts Alternatively the rows and columns of a grid can refer to a 2 D map of measurement points on the surface of one part In this case a different grid is made for each part...

Page 328: ...uary 2015 Appendix B 316 Figure 13 3 Different named grid for each part Name Elbow Rows 01 through 10 Columns A through E ID s Elbow A0 through Elbow E10 Name Tee Rows 1 through 4 Columns 1 through 3...

Page 329: ...t at A and extend past Z Example Start Column A End Column CC Column Result A B C Z AA BB CC B 3 4 2 D Matrix Grid with Custom Point A 2 D matrix grid with custom points 2D CPT file is the same as a s...

Page 330: ...oint is reached You can select either columns rows or points to increment first and one of the remaining two selections to increment second How is a 3 D grid used A 3 D grid structure may associate tw...

Page 331: ...hich refers to the actual thickness reading location at the specified elevation on the specified tube When these three dimensions are combined a single ID number is formed to precisely identify the ex...

Page 332: ...DMTA 10055 01EN Rev A February 2015 Appendix B 320...

Page 333: ...creases the strength of a signal fed into it by obtaining power from a source other than the input signal Amplitude The height of an indication on a waveform display measured from the lowest to the hi...

Page 334: ...n angle beam probe the point where the sound leaves the wedge and enters the specimen Cal block velocity Material sound velocity for the calibration block Couplant A material usually a liquid or gel u...

Page 335: ...n size reflector Distance amplitude correction DAC A method of flaw sizing that plots an on screen curve representing the echo amplitude from a known size reflector at varying distances from the trans...

Page 336: ...isappears from the test piece Flaw A discontinuity that may be undesirable but does not necessarily call for rejection depending on procedural requirements Frequency The number of complete cycles per...

Page 337: ...traight line before being reflected by the opposite surface of the material being tested Linearity vertical or amplitude The degree to which an ultrasonic instrument responds in a proportional manner...

Page 338: ...ce a voltage differential across their faces when deformed by an externally applied mechanical force and a change in their own physical configuration dimensions when an external voltage is applied to...

Page 339: ...ance such as a flat bottom hole Refraction angle of The angle with respect to perpendicular of the sound beam in the test material generated by refraction from the angle of incidence in the wedge Reje...

Page 340: ...ured from the point at which sound enters the test piece This is sometimes referred to as angular distance in angle beam testing Straight beam probe Normal beam probe A transducer that transmits sound...

Page 341: ...e top surface Wavelength The distance between like points on successive wave fronts such as the distance between any two successive particles of the oscillating medium that are in the same phase It is...

Page 342: ...DMTA 10055 01EN Rev A February 2015 Appendix C 330...

Page 343: ...s manual languages power cords etc Contact your Olympus representative for further information EP MCA X See note AC charger adaptor NOTE The part number vary according to the instrument configuration...

Page 344: ...logger software option EP600 AVERAGE U8140151 EPOCH 600 waveform averaging software option GAGEVIEWPRO U8140075 GageView Pro PC interface software GAGEVIEWPRO KIT USB A AB U8140076 GageView Pro PC in...

Page 345: ...n cable mini AB to TYPE B CLIENT 600 C VGA 5 U8780298 5 feet EPOCH 600 VGA cable 1 5 meter EP1000 C 9OUT 6 U8779017 6 feet standard 9 pin communication cable 1 8 meter 600 C RS232 5 U8780299 5 feet EP...

Page 346: ...DMTA 10055 01EN Rev A February 2015 Appendix D 334...

Page 347: ...tion pad configuration 26 Figure 1 10 Pad configuration English and international versions 27 Figure 1 11 Pad configuration Chinese and Japanese versions 28 Figure 1 12 Function and parameter keys 31...

Page 348: ...ve dialog box 70 Figure 3 21 The Resets page 71 Figure 4 1 Software main display elements 73 Figure 4 2 Software display elements in full screen mode 74 Figure 4 3 File identifier bar with ID example...

Page 349: ...ss value 154 Figure 9 8 Example of a gated signal for velocity calibration 155 Figure 9 9 Entering the Velocity Cal thickness value 156 Figure 9 10 Example of a gated signal for zero calibration 158 F...

Page 350: ...199 Figure 10 9 Viewing file content waveform 200 Figure 10 10 Viewing file content setup 201 Figure 10 11 Select ID page 202 Figure 10 12 File measurement summary 203 Figure 10 13 The Recall setup me...

Page 351: ...263 Figure 11 27 Storing the T2 point 264 Figure 11 28 Waveform Averaging option setup 266 Figure 11 29 The Waveform Averaging screen 267 Figure 11 30 Update rate less than 60 Hz 268 Figure 11 31 Act...

Page 352: ...1 50 Stored template display in live screen 295 Figure 11 51 Template setup page 296 Figure 12 1 Removing the lithium ion battery 298 Figure 13 1 2 D matrix grid 314 Figure 13 2 One grid for 75 identi...

Page 353: ...e 13 Available measurement readings 92 Table 14 Advanced filters 112 Table 15 General specifications 301 Table 16 Environmental ratings specifications 302 Table 17 Pulser specifications 303 Table 18 R...

Page 354: ...ry 2015 List of Tables 342 Table 31 Example of a BOILER file 319 Table 32 Glossary 321 Table 33 EPOCH 650 basic kit spares can be purchased 331 Table 34 EPOCH 650 software options 332 Table 35 EPOCH 6...

Page 355: ...ption 254 activation 256 crack sizing 259 envelope mode 258 manual mode 261 ASTM E164 IIW Type calibration block 181 attenuator back wall echo 268 Australia RCM compliance 3 auto measurement reading u...

Page 356: ...ransducer 2 20 33 34 digital out 34 LEMO transducer 2 34 protective cover 35 36 RS 232 Alarms 37 transmit receive 34 USB 20 38 VGA Out 36 37 curved surface correction 180 D DAC TCG software option 226...

Page 357: ...nk mode 80 127 front panel user interface 19 frozen front panel keys 299 function keys 21 31 G gain adjustment 55 reference 55 gate alarm 133 basic parameters 58 conventional UT mode 123 measurement 1...

Page 358: ...echo 130 gate tracking 130 gates 1 and 2 123 readings 92 specifications 304 membrane vent 3 20 40 menu contents 82 menus 49 73 Gate 1 59 Gate 2 59 Gate Setup 59 group of 49 pulser 56 Rcvr 56 metric u...

Page 359: ...waveform 110 adjustments 107 energy adjusting 108 menu 56 settings 55 specifications 303 R rating label 1 RCM mark 3 Rcvr menu 56 Reading setup page 91 receiver 56 adjustment 111 settings 55 specific...

Page 360: ...nternational 24 27 Korean standard 3 membrane vent 3 RCM Australia 3 RoHS 4 12 WEEE 3 11 system sensitivity adjustment 55 105 T technical support 14 test block 181 184 test mode adjusting 110 thin mat...

Page 361: ...DMTA 10055 01EN Rev A February 2015 Index 349 Waveform Averaging software option 265 waveform rectification 113 WEEE symbol 3 11 Z zoom activating 132...

Page 362: ...DMTA 10055 01EN Rev A February 2015 Index 350...

Reviews: