


U
SING
G
ROUPS
- 191 -
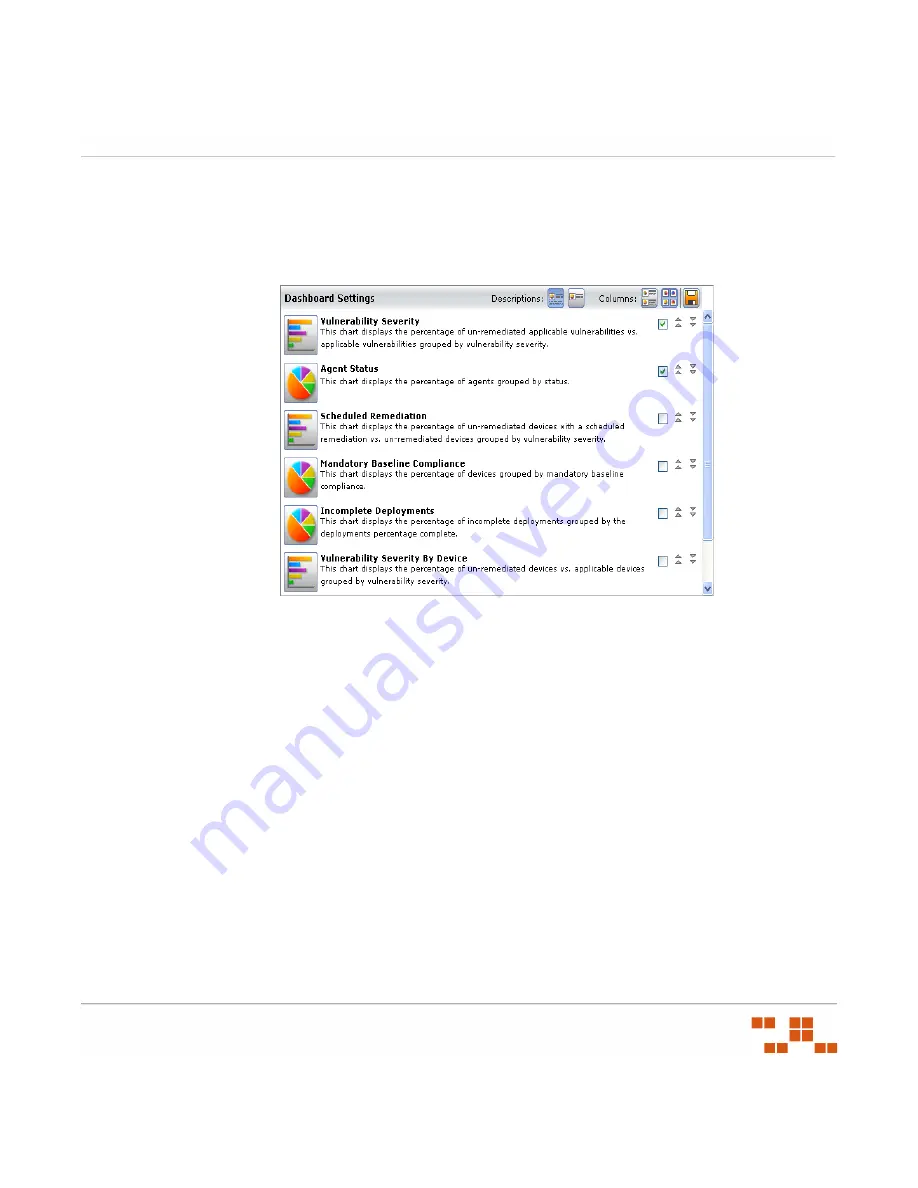
Adding a Graph to the Dashboard
1.
Click the
Dashboard Settings
icon.
S
TEP
R
ESULT
:
The
Dashboard Settings
dialog opens.
Figure 6-19:
Dashboard Settings Dialog
2.
Select check boxes associated with the charts you want to displays.
3.
Move the graphs up or down according to your priorities.
4.
Select the number of columns for display: Select a one or two column width view from
Columns
.
•
Click the
View as One Column
icon to display charts in one column.
•
Click the
View as Two Columns
icon to display charts in two columns.
5.
Display or hide the chart descriptions.
•
Click the
Show the Chart Descriptions
icon to display chart descriptions.
•
Click the
Hide the Chart Descriptions
icon to hide chart descriptions.
6.
Click
Save
.
R
ESULT
:
Your graph setting selections are saved and displayed.
Removing a Graph from the Dashboard
1.
Click the
Dashboard Settings
icon.
S
TEP
R
ESULT
:
The
Dashboard Settings
drop-down list opens.
Summary of Contents for ZENWORKS PATCH MANAGEMENT 6.4 SP2 - SERVER
Page 1: ...User Guide ZENworks Patch Management 6 4 SP2 ...
Page 44: ...USING ZENWORKS PATCH MANAGEMENT 28 ...
Page 138: ...WORKING WITH DEPLOYMENTS 122 ...
Page 212: ...USING GROUPS 196 ...
Page 236: ...REPORTING 220 ...
Page 308: ...CONFIGURING DEFAULT BEHAVIOR 292 ...
Page 332: ...USING THE AGENT 316 The Agent Control Panel opens Figure 10 19 Agent Control Panel ...


