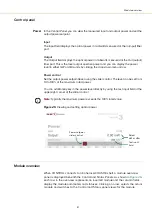
Graphing
50
Errors and status indicators
For each module, click on the
Error and Statu
s
tab to view the status indicators and
any error codes that may be displayed.
Status indicators
The status indicators are lit green if the condition in the text is true.
Errors
If an error code is listed and cannot be cleared contact NKT Photonics support, see
“Support contact details” on page 90
.
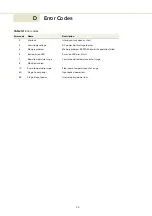
For a list of error codes and their descriptions, see
.
Figure 36
Error and status tab
Graphing
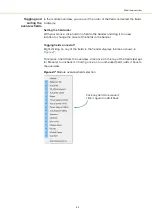
As shown in
, you can graph the values of selected parameters by clicking
on the
Graph
tab and selecting the parameters to graph. To use the graphing
function:
1.
Select up to three parameters to graph from the drop-down menu at both the left
and right y-axes and at the x-axis of the graph.
2. Modify the left/right y-axes and x-axis maximum range with the input boxes.
3.
Set the sample number and rate using the input boxes to the left of the graph.
Error code
Summary of Contents for Koheras BOOSTIK
Page 1: ...Item 800 631 01 Koheras BOOSTIK PRODUCT GUIDE Narrow linewidth laser amplifier...
Page 10: ...10...
Page 14: ...14...
Page 44: ...Module overview 44...
Page 51: ...51 Graphing Figure 37 Graphing tab X axis setting Y axes settings...
Page 52: ...Graphing 52...
Page 58: ...58 2...
Page 60: ...60 2...
Page 66: ...66...
Page 67: ......
Page 68: ...1 Koheras BOOSTIK Product Description Revision 1 0 09 2021 W 10456...


