


Disk Statistics
Clicking
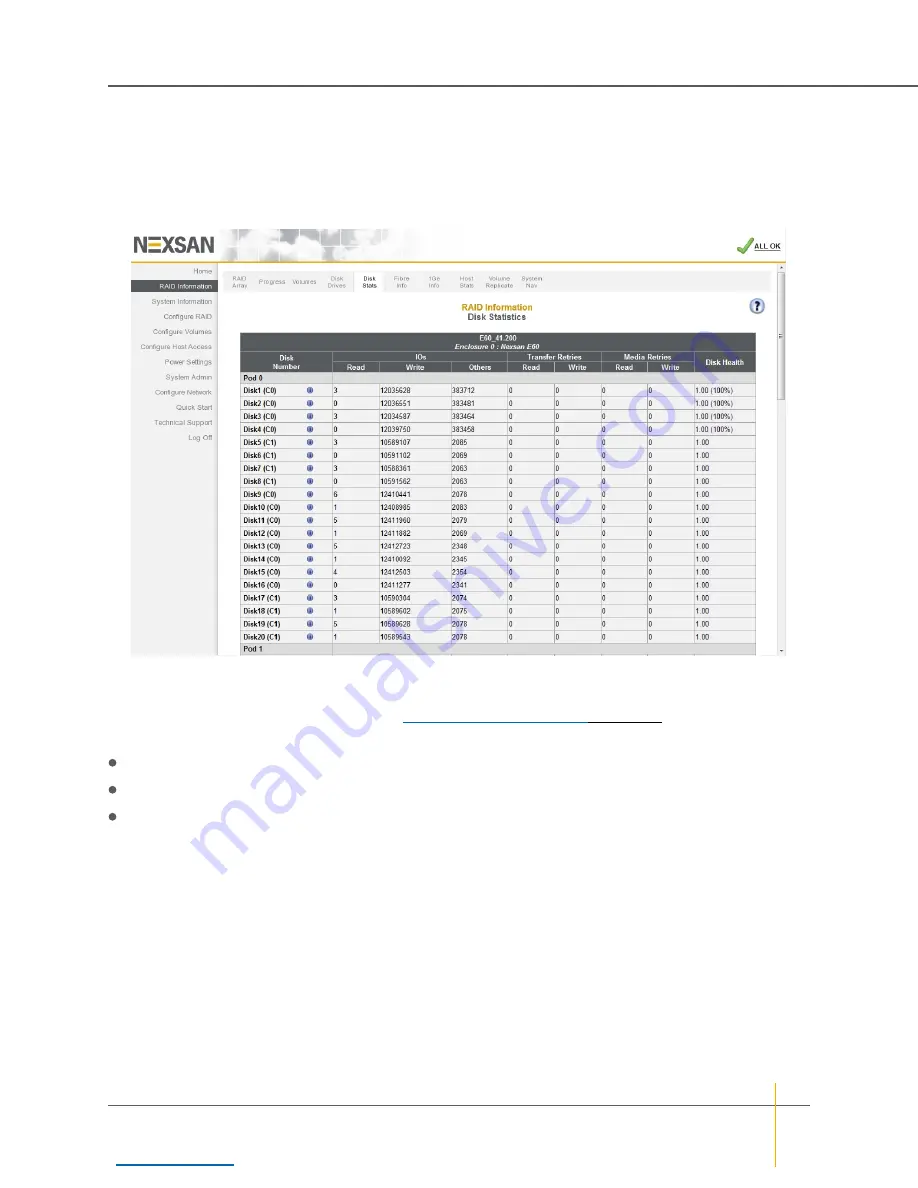
RAID Information > Disk Stats
takes you to the
Disk Statistics
page, which displays data on how
often individual disks have been accessed and how many retries have been performed in data recovery
attempts. On E-Series systems, this information is organized by drawer (
Pod 0
,
Pod 1
, etc.).
Figure 3-23:
Disk Statistics
page
The
Disk Number
column displays the disk number, the controller to which it belongs, and an information icon.
Hover the mouse over the information icon for a pop-up dialog that displays that disk’s information. Click the
icon to be taken to that disk’s detail page (see
The
IOs
column displays the number of input/output operations (I/Os) performed on the disk.
Read
indicates the number of times the drive has been read because of host array access.
Write
indicates the number of times the drive has been written to because of host array access.
Others
indicates the number of times that the drive has been accessed by the RAID Controller directly.
Examples include array creation, array rebuilds, and verifications.
The
Transfer Retries
column displays the number of times (for
Read
and
Write
operations, respectively) that
the RAID Controller has had to retry an I/O operation due to data transfer problems.
The
Media Retries
column displays the number of times (for
Read
and
Write
operations, respectively) that the
RAID Controller has had to retry an I/O operation due to disk media problems.
The
Disk Health
column displays a numerical assessment of each drive’s performance based on command
completion times aggregated over time. For SSD drives, it also displays the percentage of expected disk life
left.
Chapter 3: The Graphical User Interface — RAID Information
Nexsan High-Density Storage
User Guide
77