


Viewing Channel Usage
25
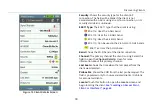
Signal Level
: The real-time signal level (in dBm) of the
strongest AP signal on the channel.
Noise:
The measured real-time noise level.
SNR:
The measured real-time signal-to-noise ratio.
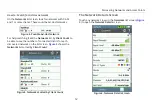
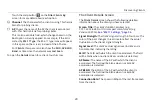
The Channels Overlap Screen
The Channels Overlap screen displays a graphical
representation of the discovered APs' utilization of each
channel. This screen displays in landscape view. Channel
numbers are on the x-axis, and the signal level in dBm is
displayed on the y-axis of the graph.
Touch the tab buttons across the top of the graph to display
the different bands and corresponding channels:
2.4 GHz
— Channels 1-14
5 GHz UNII-1/2
— Channels 36-64 (not including 34,
38, 42, or 46)
5 GHz UNII-2 Ext
— Channels 100-144
5 GHz UNII-3
— Channels 149-165
A colored parabola is shown on the graph for each active
Access Point the AirCheck G2 detects.
Touch an AP's parabola to open the corresponding
AP Details
screen.
Figure 13. Channels Overlap Screen
The parabolas are displayed using the following
characteristics:
The width of the parabola represents the width of the
channel: 20, 40, 80, or 160 MHz.
The vertical height of the parabola represents the
current signal level (in dBm) of the AP, correlating with
the y-axis.
The parabola is centered on the center channel (x-
axis) being used by the AP.


