90
8 OPERATION EXAMPLE
8.2 Logging Data before and after Trigger Occurrence
Graphical display of data
Display logged data in a graph using GX LogViewer, and check the values.
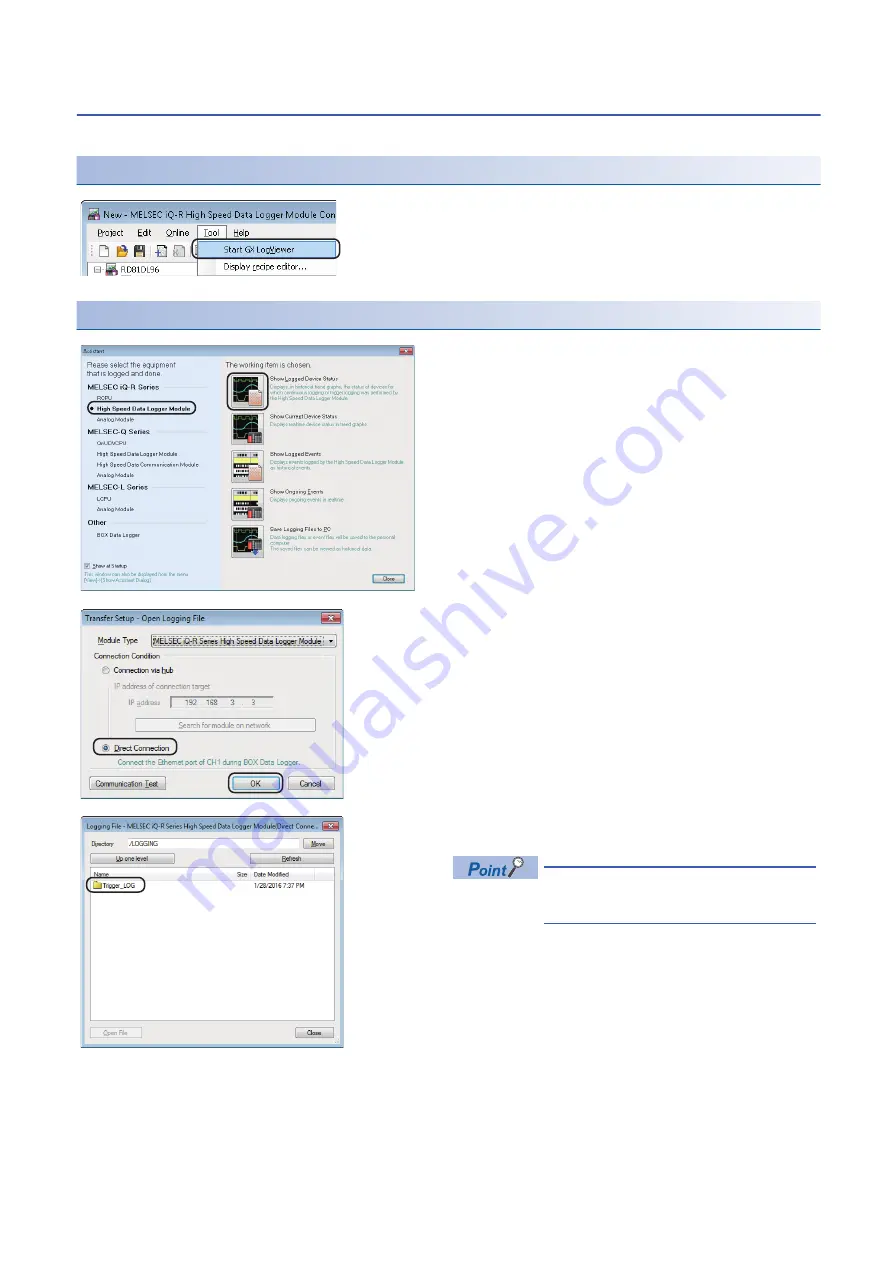
Start GX LogViewer
Specify the data to be displayed
1.
Select [Tool]
[Start GX LogViewer].
GX LogViewer is started.
1.
Select "High Speed Data Logger Module" of "MELSEC
iQ-R Series", and click the icon of "Show Logged Device
Status"
2.
Select "Direct Connection", and click the [OK] button.
3.
Double-click each folder in the following order:
"Trigger_LOG"
→
"00000001"
Click the [Refresh] button when the folder is
not displayed in the list.
Summary of Contents for RD81DL96
Page 2: ......
Page 80: ...78 7 INSTALLATION AND UNINSTALLATION 7 2 Uninstallation Procedure MEMO ...
Page 115: ...8 OPERATION EXAMPLE 8 3 Creating Reports from Continuously Logged Data 113 8 MEMO ...
Page 117: ...APPX Appendix 1 External Dimensions 115 A MEMO ...
Page 119: ...I 117 MEMO ...
Page 123: ......


