T
-P
LOT
R
EPORT
The
t-
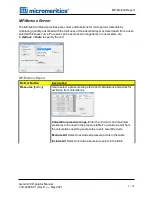
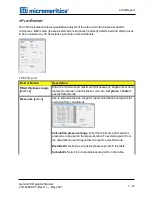
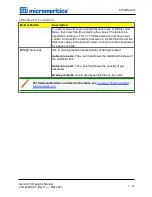
Plot calculation allows quantitative analysis of the area and total volume ascribed to
micropores. Matrix area (the area external to micropores) is directly determined and often proves
to be a valuable way of characterizing complex mixed materials.
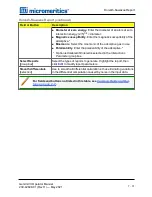
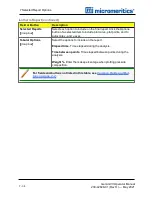
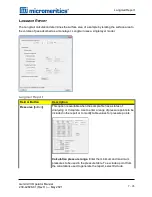
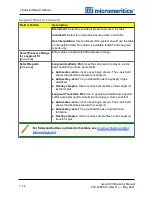
Field or Button
Description
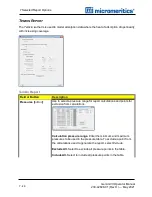
Fitted thickness range
[
text box
]
Enter the minimum and maximum thicknesses (in angstroms or nano-
meters) to include in the thickness curve. Go to
Options > Units
to
specify default units.
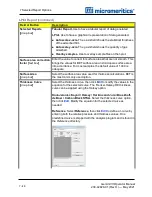
Pressures [
button
]
Use to select a pressure range for report calculations and points for
exclusion from calculations.
Calculation pressure range.
Enter the minimum and maximum
pressures to be used in the pressure table.To exclude a point from
the calculations used to generate the report, select
Exclude
.
Exclude All.
Select to exclude all pressure points in the table.
Include All.
Select to include all pressure points in the table.
t-Plot Report
t-Plot Report
Gemini VII Operator Manual
239-42828-01 (Rev H ) — May 2021
7 - 45
Summary of Contents for GEMINI VII
Page 1: ...OPERATOR MANUAL 239 42828 01 May 2021 Rev H GEMINI VII SURFACE AREA ANALYZER ...
Page 10: ......
Page 16: ......
Page 92: ......
Page 126: ...6 About Reports SAMPLE LOG REPORT 6 34 Gemini VII Operator Manual 239 42828 01 Rev H May 2021 ...
Page 127: ...T PLOT REPORT t Plot Report Gemini VII Operator Manual 239 42828 01 Rev H May 2021 6 35 ...
Page 128: ...6 About Reports VALIDATION REPORT 6 36 Gemini VII Operator Manual 239 42828 01 Rev H May 2021 ...
Page 234: ......
Page 242: ......
Page 244: ......
Page 247: ......
Page 248: ......

