


58 | 120
blue’Log X series
12.2
Showing meter values
12.2.1
Diagrams
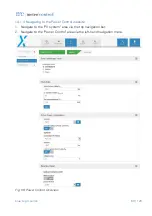
1.
Navigate to the "Cockpit" area via the top navigation bar.
2.
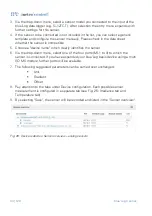
Navigate to the "Diagrams" area via the left-hand navigation menu and select
"Meters".
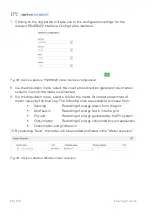
Fig. 45: Device websites: Selecting meter diagram options
3.
Select the meter(s) from which to visualize the measured values.
4.
Select the available measured values. All measured values available for the
selected meters will be shown. If an individual meter is selected, a number of
measured values can be shown in parallel. If several meters are selected, only one
measured value can be shown in each case.
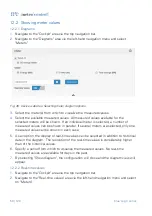
5.
As an option, the display of real-time values can be selected in addition to historical
data in the diagram. The resolution of the real-time values is considerably higher
than of the historical values.
6.
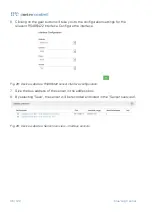
Specify a period from which to visualize the measured values. No real-time
measured values are available for days in the past.
7.
By selecting "Show diagram", the configuration will close and the diagram view will
appear.
12.2.2
Real-time values
1.
Navigate to the "Cockpit" area via the top navigation bar.
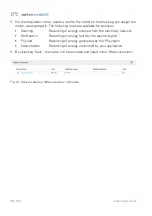
2.
Navigate to the "Real-time values" area via the left-hand navigation menu and select
on "Meters".