LeadCare Ultra
®
Blood Lead Testing System User’s Guide
5-7
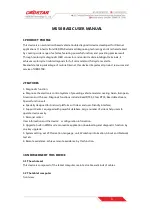
5.8.1 Displaying Quality Control Charts
Quality control charts allow you to view each result in comparison to the target value for any given lot
number.
►
Follow These Steps
1. To display quality control charts, click
View
>
Quality Control Tests
. The “Quality Control Test
View” dialog box displays as shown in Figure 5-1.
2. Use filters to choose which QC results to view as described in Section 5.8, (steps 2-4); then,
click the
View Charts
button to generate graphs of the selected QC data.
3. In the “Quality Control Chart Viewer”, a separate chart is created for each control level and
sensor lot (see Figure 5-4). The description for each chart generated appears in a column on
the left-hand side of the display. The chart displayed to the right corresponds to the highlighted
chart description.
Figure 5-4: Quality Control Charts
4. To view a different chart, click on the chart description in the left column.
Summary of Contents for LeadCare Ultra
Page 16: ...LeadCare Ultra Blood Lead Testing System User s Guide 2 6 This page intentionally left blank ...
Page 62: ...LeadCare Ultra Blood Lead Testing System User s Guide 6 20 This page intentionally left blank ...
Page 92: ...LeadCare Ultra Blood Lead Testing System User s Guide 11 2 This page intentionally left blank ...
Page 96: ...LeadCare Ultra Blood Lead Testing System User s Guide 13 2 This page intentionally left blank ...
Page 102: ...LeadCare Ultra Blood Lead Testing System User s Guide A 4 This page intentionally left blank ...
Page 103: ...LeadCare Ultra Blood Lead Testing System User s Guide B 1 ...
Page 104: ...LeadCare Ultra Blood Lead Testing System User s Guide B 2 ...
Page 116: ...LeadCare Ultra Blood Lead Testing System User s Guide B 12 This page intentionally left blank ...
Page 118: ...LeadCare Ultra Blood Lead Testing System User s Guide C 2 This page intentionally left blank ...