


ODiSI 6
ODiSI 6
User’s Guide
Page 14
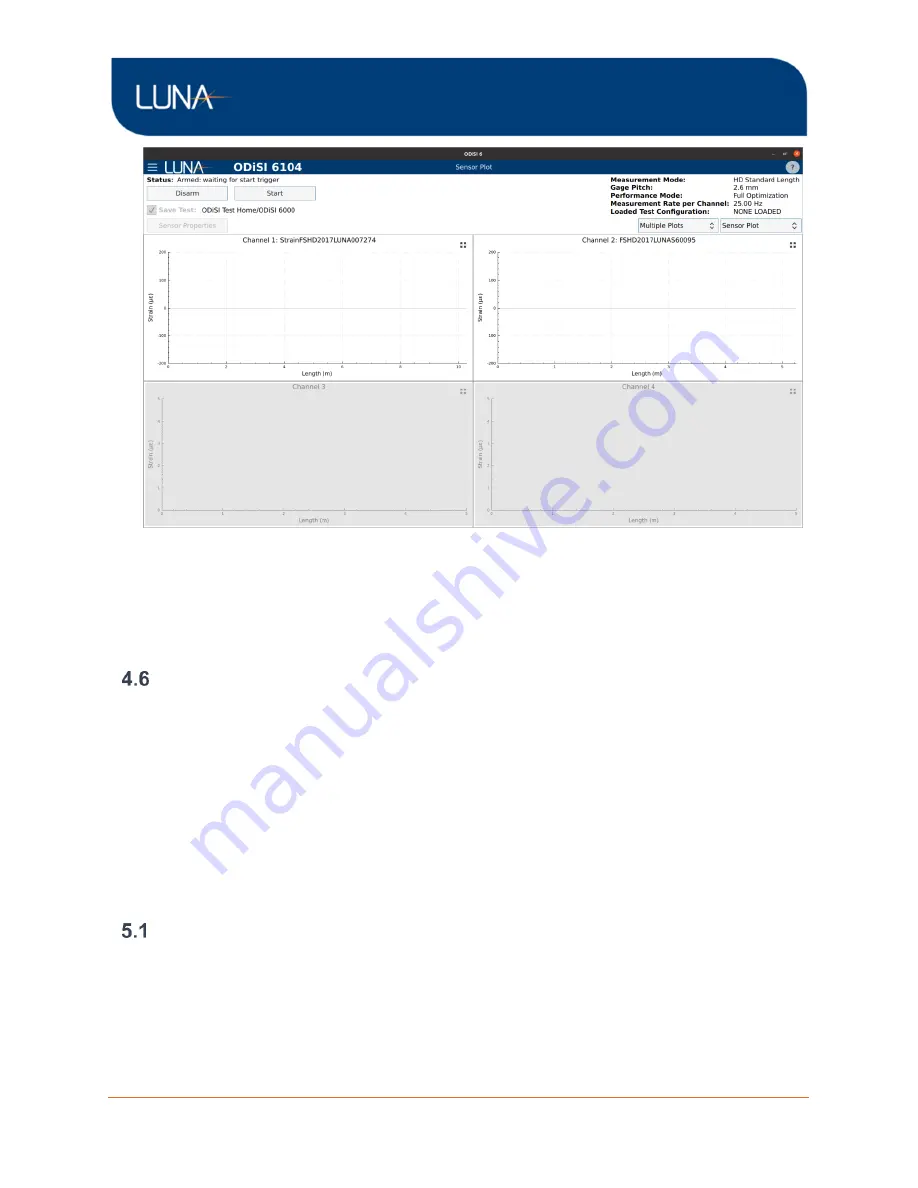
Figure 4-2: Arming a test shows the Sensor Plot screen
When a test is running, the Sensor Plot and Gage Plot visualizations are available. The Sensor
Plot allows viewing of the strain or temperature along all sensors, and the
“Gage Plot” allows
viewing strain or temperature measurements from select individual gage locations along all
sensors, over time.
View Test Data
Test data is logged in binary files that are stored in the Test Data folder on the controller. Test
data can be played back through the
“Play Back Test Data” function and can be converted to
human readable tab delimited .tsv files through the
“Generate Test Data TSV Files” function.
These TSV files can be opened in external programs such as Excel or Matlab for further data
analysis.
5
Software Quick Start Guide
This chapter quickly goes through the process of setting up a single channel ODiSI test with
test data file logging enabled. The test data file is then opened for playback afterwards.
Operational Parameters
1.
Launch the software.
a.
Double click the “OD6” desktop shortcut. The application window will display
an
“Initializing” status. Once this reaches 100%, the main software interface is
active.
2.
Check that the
“Status” is updated to “Ready”.


