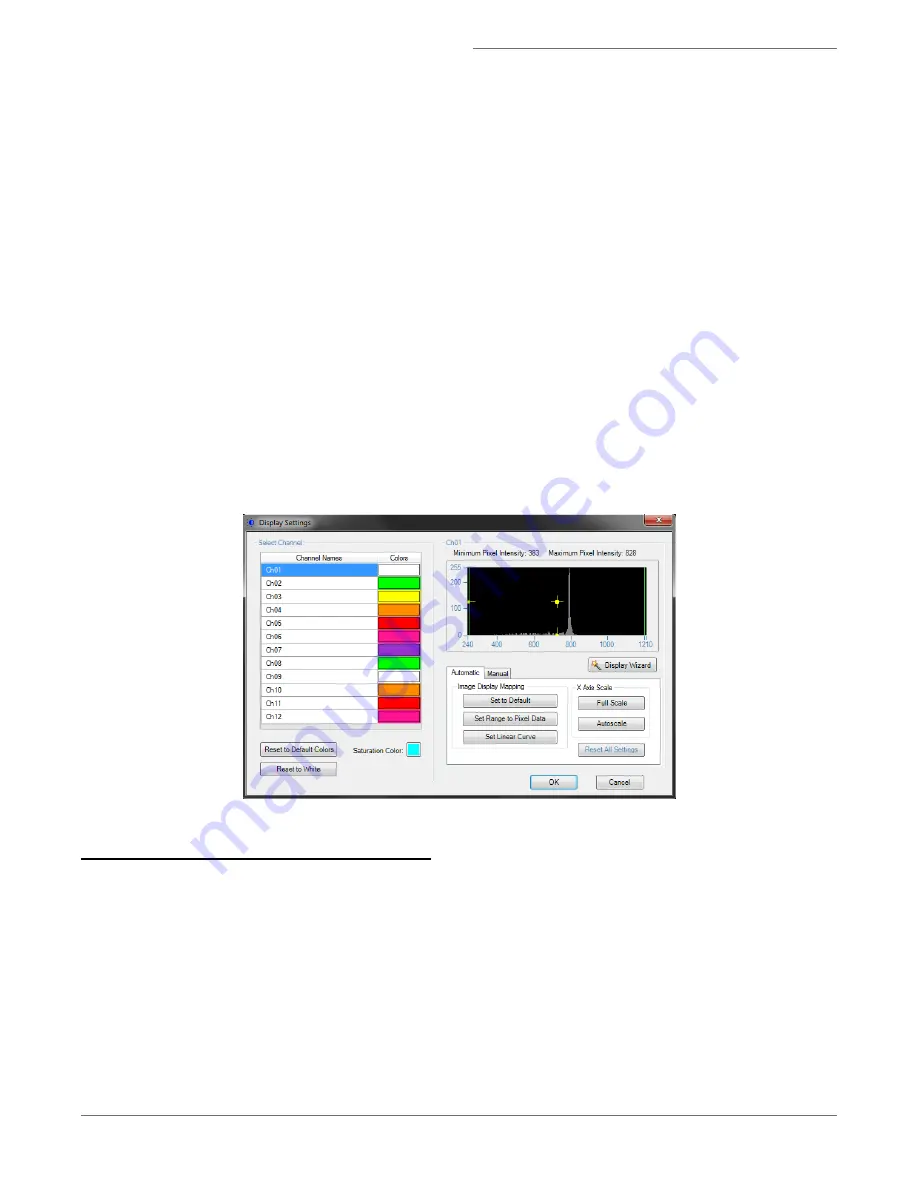
5. To set the display mapping adjust the right and left green bars in the graph. You will adjust the Display Intensity set-
tings on the graph (the Y Axis), to the Pixel Intensity (the X axis). The range of pixel intensities is 0-4095 counts.
The display range is 0–255. The pixel intensities shown in gray are gathered from the images coming through in the
specific channel and updates with every 10 images. Updates to the adjustments can be visualized in the image gal-
lery.
At each intensity on the X Axis of the graph, the gray histogram shows the number of pixels in the image. This his-
togram provides you with a general sense of the range of pixel intensities in the image. The dotted green line maps
the pixel intensities to the display intensities, which are in the 0–255 range.
Manual setting is done by Click-dragging the vertical green line on the left side (crossing the X Axis at 0) allows you
to set the display pixel intensity to 0 for all intensities that appear to the left of that line. Doing so removes back-
ground noise from the image.
Click-dragging the vertical green line on the right side allows you to set the display pixel intensity to 255 for all
intensities that appear to the right of that line.
If a non-linear mapping occurs by moving the yellow cross hair, click Set Linear Curve to return to a linear trans-
formation.
NOTE: Changing the display properties does not change the pixel intensity data. They are for display purposes
only.
Setting up the Work Area
Create scatterplots or histograms with the tools in the analysis area.
The quantitative features that are available to graph the data are listed in the table below. Features are algorithms that
are applied to a specific region of interest of the image defined by a segmentation mask and image pixel values defined
by the channel image. Segmentation masks are named M01 through M12 indicating intensities above background in the
respective channel. MC is the combination of all of the individual channel masks. Feature names are described by the
Feature_Mask_Image. For example Intensity_M02_Ch02 indicates the sum of all channel 2 pixel intensities in Mask
M02.
For Research Use Only. Not for use in diagnostic procedures.
27
Amnis
®
FlowSight
®
Imaging Flow Cytometer User Manual


