Format | Chart
CentreVu Report Designer Version 8 User Guide
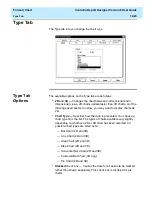
3D Effects Tab
12-24
●
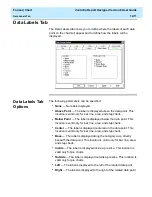
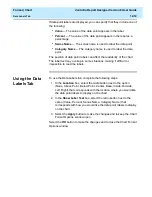
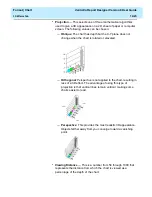
Width to Height — This is a number from 5 through 2000 that
represents the percentage of the chart’s height that is used to draw
the chart’s width.
●
Depth to Height — This is a number from 5 through 2000 that
represents the percentage of the chart’s height that is used to draw
the chart’s depth.
Using the 3D
Effects Tab
12
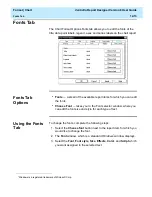
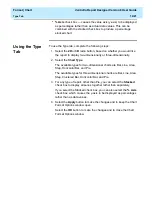
To use the 3D Effects tab, complete the following steps:
1. Change the degree of Elevation (top to bottom) of the chart by
typing a new number in the Elevation box.
2. Change the degree of Rotation of the chart by typing a new number
in the Rotation box.
3. Change the type of Projection used for the chart by selecting a type
from the Projection drop-down list.
4. Edit the ratios of width to height and depth to height, as appropriate.
5. Select the Apply button to make the changes and to keep the Chart
Format Options window open.
Select the OK button to make the changes and to close the Chart Format
Options window.
Summary of Contents for CentreVu Report Designer
Page 4: ......
Page 18: ...Introduction CentreVu Report Designer Version 8 User Guide Related Documents 1 8...
Page 102: ...Edit Inputs CentreVu Report Designer Version 8 User Guide Viewing the Input Window 6 16...
Page 198: ...Format Text CentreVu Report Designer Version 8 User Guide Formatting Text on the Report 15 4...
Page 264: ...Index CentreVu CMS R3V8 Upgrades and Migration IN 10...
Page 266: ......

