Format | Chart
CentreVu Report Designer Version 8 User Guide
Type Tab
12-20
Type Tab
12
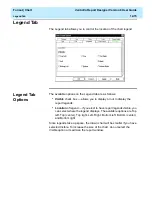
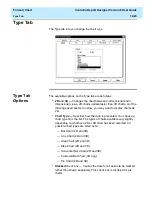
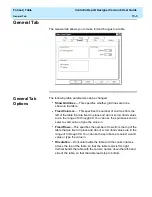
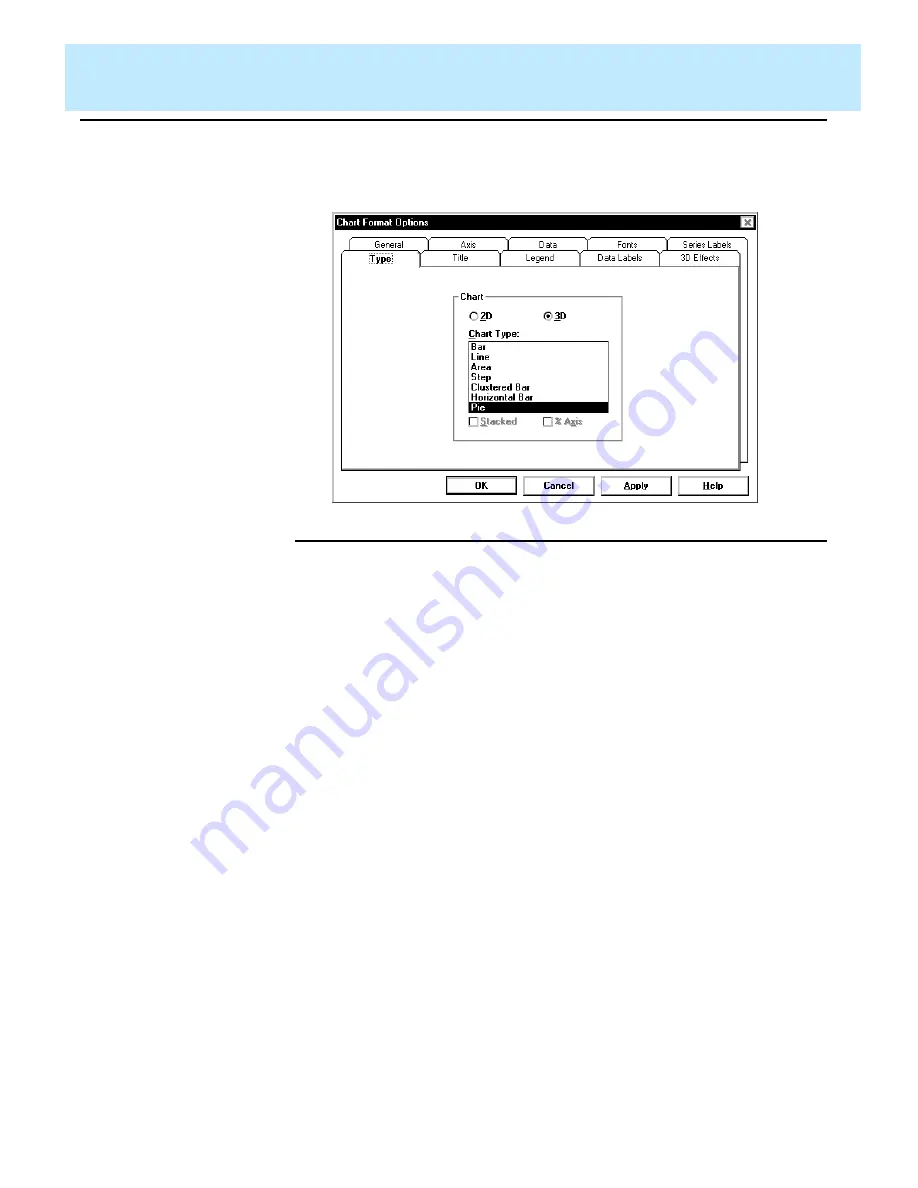
The Type tab lets you change the chart type.
Type Tab
Options
12
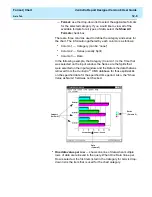
The available options on the Type tab are as follows:
●
2D and 3D — Changes the chart between 2-dimensional and 3-
dimensional views. 2D charts update faster than 3D charts, so if the
drawing speed seems too slow, you may want to display charts as
2D.
●
Chart Type — Specifies how the data is presented. You choose a
chart type from the list. The types of charts available vary slightly
depending on whether a 2D or 3D chart has been selected. All
possible chart types are listed here:
— Bar Chart (2D and 3D)
— Line Chart (2D and 3D)
— Area Chart (2D and 3D)
— Step Chart (2D and 3D)
— Horizontal Bar Chart (2D and 3D)
— Clustered Bar Chart (3D only)
— Pie Chart (2D and 3D).
●
Stacked check box — Causes the data for all series to be stacked
rather than shown separately. This check box is disabled for pie
charts.
Summary of Contents for CentreVu Report Designer
Page 4: ......
Page 18: ...Introduction CentreVu Report Designer Version 8 User Guide Related Documents 1 8...
Page 102: ...Edit Inputs CentreVu Report Designer Version 8 User Guide Viewing the Input Window 6 16...
Page 198: ...Format Text CentreVu Report Designer Version 8 User Guide Formatting Text on the Report 15 4...
Page 264: ...Index CentreVu CMS R3V8 Upgrades and Migration IN 10...
Page 266: ......

