Insert | Chart
CentreVu Report Designer Version 8 User Guide
Inserting a Chart on a Report
8-4
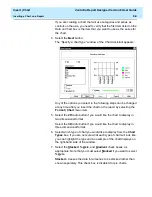
% Axis - Causes the value axis (y-axis) to be displayed as
percentages rather than as actual data values. This can be
combined with the stacked check box to produce a percentage
stacked chart.
Gradient - Allows you to specify whether the backdrop of the chart
is a solid color or whether it is displayed as a gradient, a smooth
transition from one color to another. The gradient transition can be
one of the following: Horizontal, Vertical, Rectangle, or Oval. The
quality of the gradient effect will vary depending on the video card
installed in the PC, or the capabilities of the printer for printed
reports.
8. Select the Rolling check box if you want the real-time chart report to
scroll through the refreshes as they occur. If you select the Rolling
check box, you need to define the Number of Data Points
(refreshes) that will be included on the chart.
9. Select the Next button.
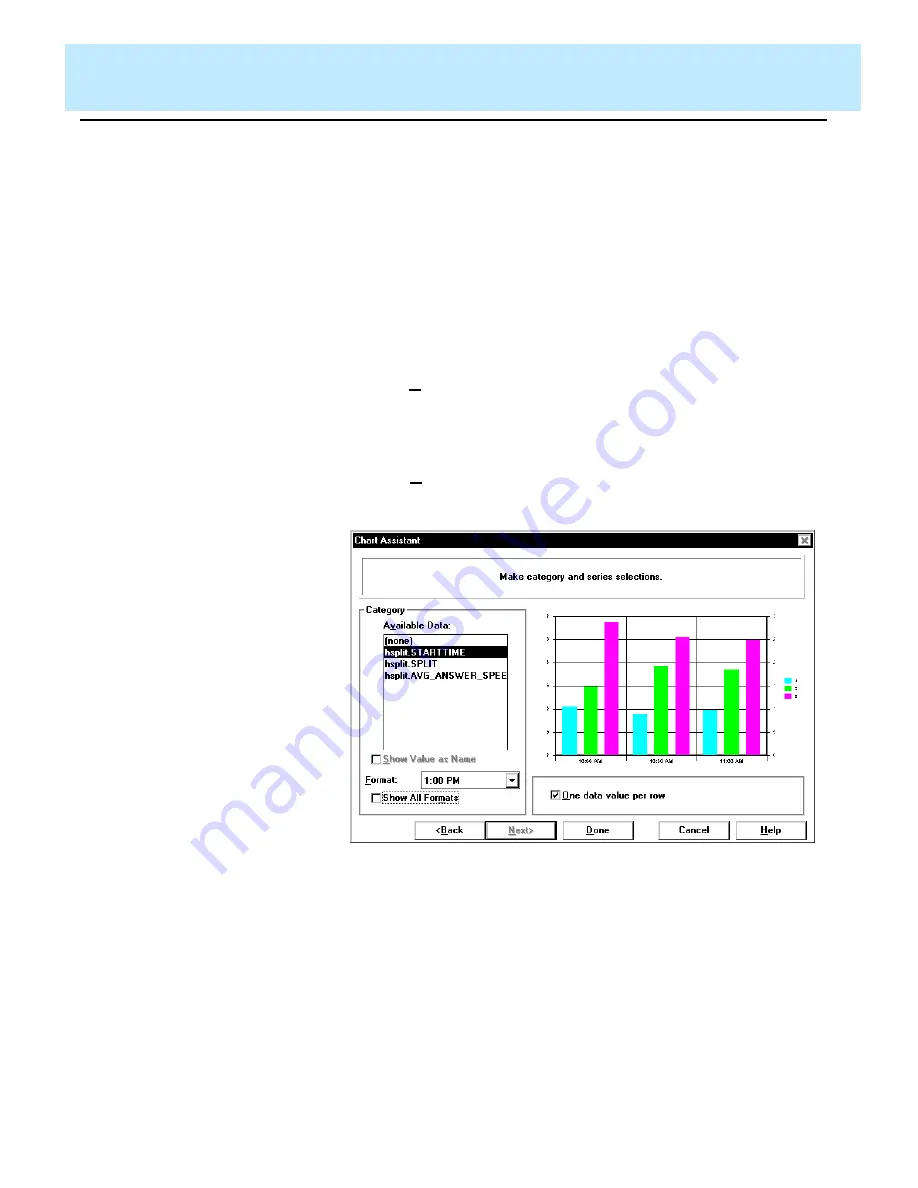
The “Make category and series selections” window appears:
This window is where you define how the data will be displayed on
the axis of the chart
There are three columns used to define the category and series for
the chart. The information gathered by each column is as follows:
●
Column 1 — Category (can be “none”)
●
Column 2 — Series (usually Split)
●
Column 3 — Data.
Summary of Contents for CentreVu Report Designer
Page 4: ......
Page 18: ...Introduction CentreVu Report Designer Version 8 User Guide Related Documents 1 8...
Page 102: ...Edit Inputs CentreVu Report Designer Version 8 User Guide Viewing the Input Window 6 16...
Page 198: ...Format Text CentreVu Report Designer Version 8 User Guide Formatting Text on the Report 15 4...
Page 264: ...Index CentreVu CMS R3V8 Upgrades and Migration IN 10...
Page 266: ......

