3DM
®
-GX5-10
User Manual
3.6
Data Monitoring and Recording
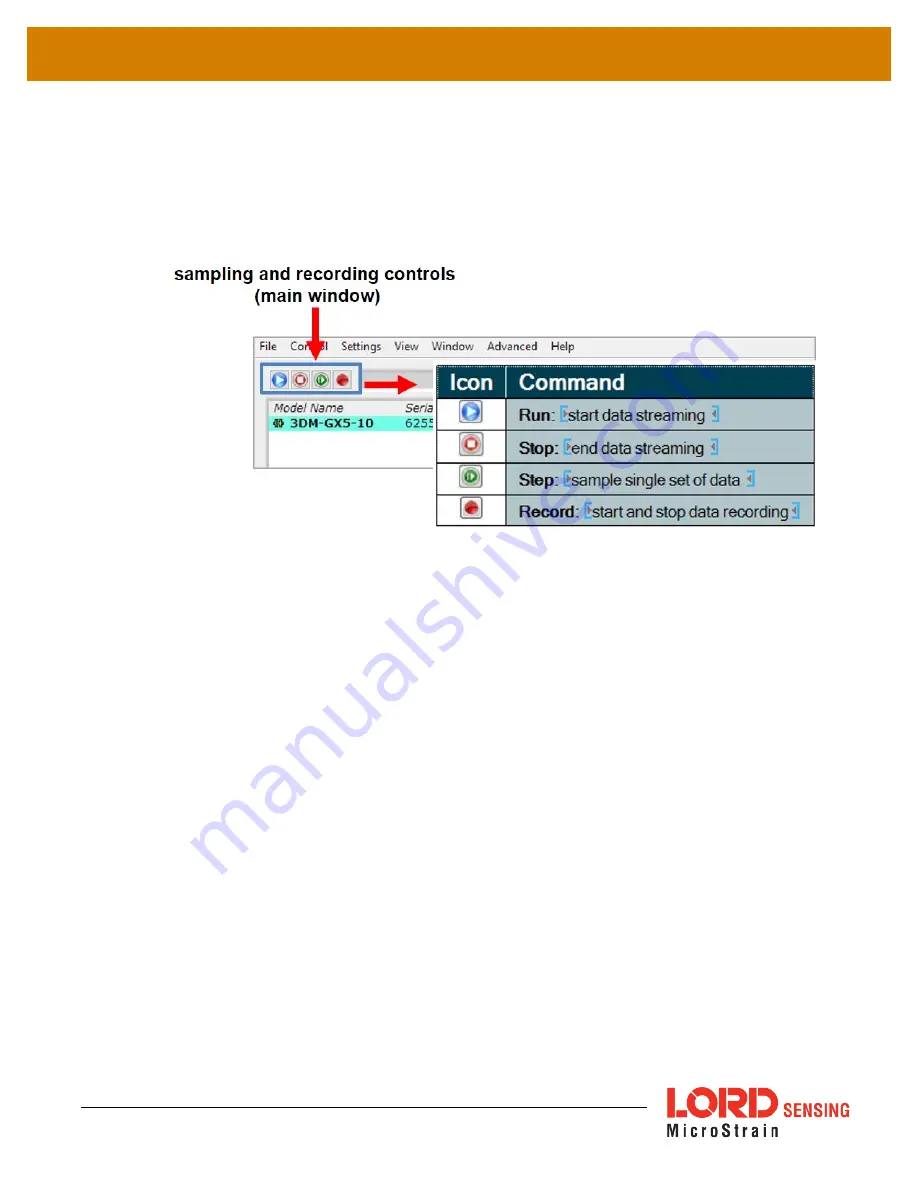
Throughout the MIP Monitor views the same icons are used to control data streaming (sampling) and
recording. These icons can be found in the MIP Monitor main window icon toolbar and in each data
monitoring window. The same commands are also found in the main window Control menu.
Figure 11 -Main Window Controls
There are several data monitoring views available depending on what measurements are desired for
monitoring and recording. Each view corresponds to one of the main categories in the Device Settings
window. For example, the 3DM - GX5 - 10 includes Sensor Data Monitoring for the IMU/AHRS
measurements . During viewing and recording only the outputs that are selected in the Message
Format tab of the Device Settings menu are displayed and recorded (
see Sensor Settings on page 15
).
Data streaming must be started in order for data to be recorded, however it is not necessary to view it in
a data monitoring window. Data monitoring is used primarily to confirm the system is operating
correctly or to view the outputs in near real time. If sensor setup has already been confirmed, streaming
and recording can be initiated from the main window.
is an example of Sensor Data Monitoring, which displays the selected
IMU/AHRS measurements. In data monitoring windows, no data will be displayed until data streaming
is started, and no data will be recorded (even if it is being viewed) until data recording is initiated
(armed). In the example below, the y- axis of the graph indicates data points, the x- axis is the
measurement units, and there is a tab for each measurement.
1. Right- click on the device in the MIP Monitor software main window, and select
Sensor Data Monitor.
2. Click the blue Start Streaming icon to start sampling.
17


