


18.10 Chart display
The Chart Display menu option determines the level
of detail that is displayed on-screen.
The Chart display menu option is only available
when using vector based cartography.
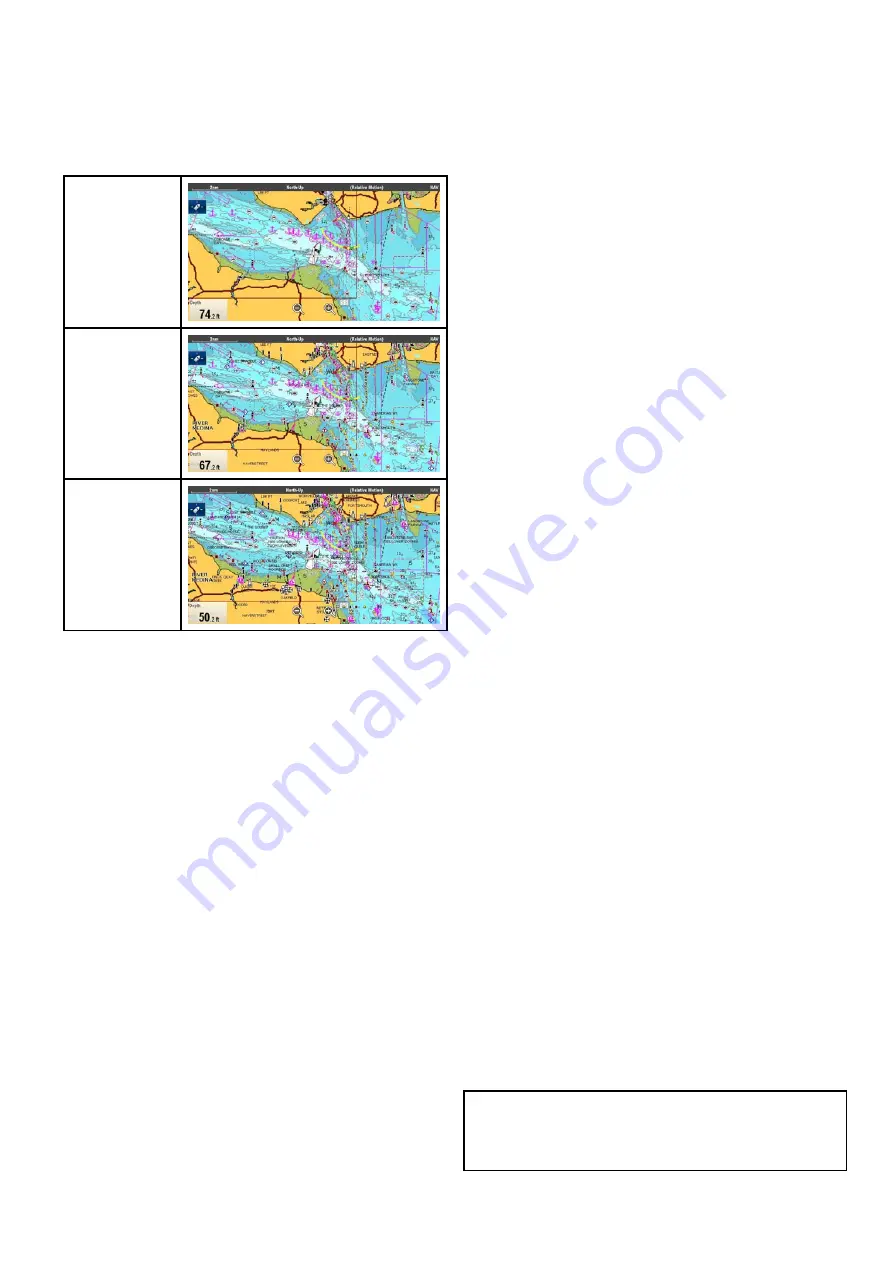
The Chart display options are shown below.
Simple
Detailed
Extra Detailed
The level of detail shown on-screen is also affected
by the cartography
Chart detail
settings. Refer to
for information.
Changing the chart display detail
From the Chart application menu:
1. Select
Presentation
.
2. Select
Chart Detail
.
The following options are available:
• Simple
• Detailed
• Extra Detailed
3. Select the required option.
18.11 Overlays
The chart has a number of overlays that display
different views and information. The overlays require
electronic charts with the appropriate feature support
and may also require additional hardware and
service subscriptions.
You can overlay the following data onto a 2D chart
to give greater depth of information. The overlays
available are:
• *
AIS
— View and track AIS targets. This overlay
is not available in 3D view.
• *
Radar
— Overlay radar onto the chart. This
overlay is not available in 3D view.
• **
Aerial
— Provides an aerial / satellite
photography overlay.
• **
Aerial Overlay:
— Determines the coverage of
the aerial overlay.
• *
NOWRad
— Provides the NOWRad weather
radar overlay. This overlay is not available in 3D
view.
•
Databoxes
— Select whether databoxes are
displayed on-screen and what data is displayed.
•
Chart Grid
— Determines whether grid lines
representing longitude and latitude are displayed
on the chart.
• **
2D Shading
— Determines whether terrain
shading is displayed in 2D view.
• **
Community Edits
— Determines whether the
community layer is enabled or disabled.
• **
Chart Text
— Determines whether chart text is
displayed (place names and so on).
•
Chart Boundaries
— Determines whether a line
indicating the chart boundary is displayed.
•
Range Rings
— View range rings in the Chart
application. This overlay is not available in 3D
view.
•
Safe Zone Ring
— View safe zone ring. This
overlay is not available in 3D view.
•
Fuel Range Ring
— View the fuel range ring. This
overlay is not available in 3D view.
•
Boat Size
— Determines the size of the boat icon
on-screen.
•
Waypoint Name
— Determines whether the
Waypoint names are displayed next to waypoints.
•
Route Width
— Determine the width of route lines
on-screen.
•
Track Width
— Determine the width of track lines
on-screen.
Note:
* Additional hardware required.
** If supported by your cartography type.
Chart application
245
Summary of Contents for a125
Page 2: ......
Page 6: ......
Page 16: ...16 a Series c Series e Series ...
Page 43: ...13 GPS receiver 14 Thermal camera 15 Wireless connection Planning the installation 43 ...
Page 50: ...50 a Series c Series e Series ...
Page 82: ...82 a Series c Series e Series ...
Page 114: ...114 a Series c Series e Series ...
Page 120: ...120 a Series c Series e Series ...
Page 186: ...186 a Series c Series e Series ...
Page 190: ...190 a Series c Series e Series ...
Page 208: ...208 a Series c Series e Series ...
Page 230: ...230 a Series c Series e Series ...
Page 320: ...320 a Series c Series e Series ...
Page 340: ...340 a Series c Series e Series ...
Page 364: ...364 a Series c Series e Series ...
Page 420: ...420 a Series c Series e Series ...
Page 424: ...424 a Series c Series e Series ...
Page 434: ...434 a Series c Series e Series ...
Page 459: ......
Page 460: ...www raymarine com ...


