23
Run Sample,
continued
Set gates and
thresholds
The Tali
™
Image-Based Cytometer allows you to set gates or thresholds on cell size
and relative fluorescence from available channels for data collection. After capturing
images of your sample, follow the instructions below to set the thresholds for cell
analysis. The example below shows how to set gates and thresholds for the Tali
™
Apoptosis Assay.
1.
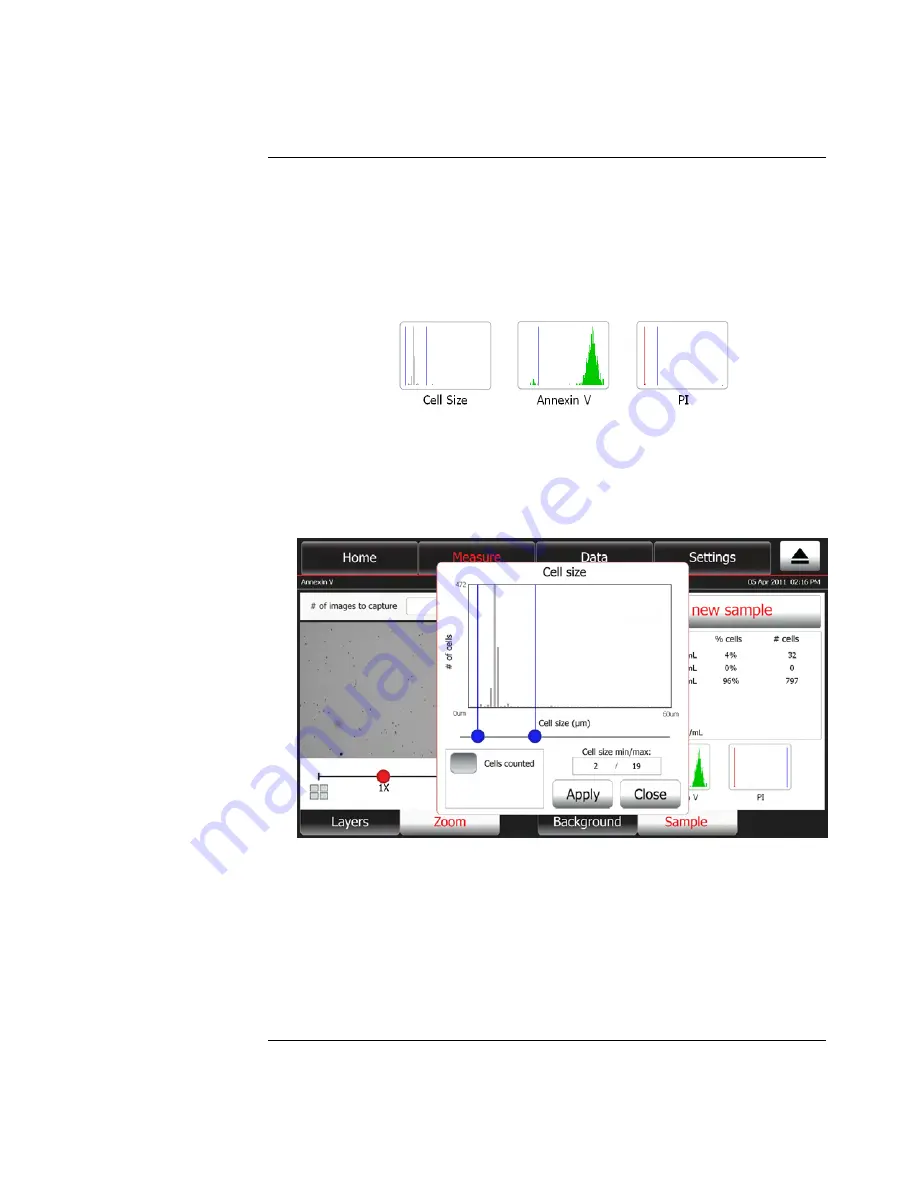
To set the gating parameters (i.e., lower and upper boundaries) for cell size,
touch the
Cell size
thumbnail histogram.
Note:
The procedure for setting gates and thresholds is identical for all Tali
™
Assays, but
the buttons on the touch screen are labeled differently for each specific assay. For
example, the histograms are labeled Cell size, Annexin V, and PI for the Tali
™
Apoptosis
assay. The thin blue lines on the thumbnails histograms depict the set thresholds.
2.
The pop-up window displays the “Cell size vs. # of cells” histogram and the
slider bar for adjusting the lower and upper boundaries for cell size.
3.
Move the two
blue buttons
on the slider bar horizontally to set the lower and
upper boundaries for cell size. The blue vertical bar on the left determines the
minimum cell size and the one on the right the maximum cell size. The values
set are also displayed under the graph.
4.
Touch
Apply
to confirm and return to the previous screen. Only cells that fall
within the set boundaries are included in the calculations and the data is
updated with the new count.
To return to the previous screen without setting the threshold for cell size, touch
Close
.
Continued on next page


