Chapter 6: Using the Web Interface
110
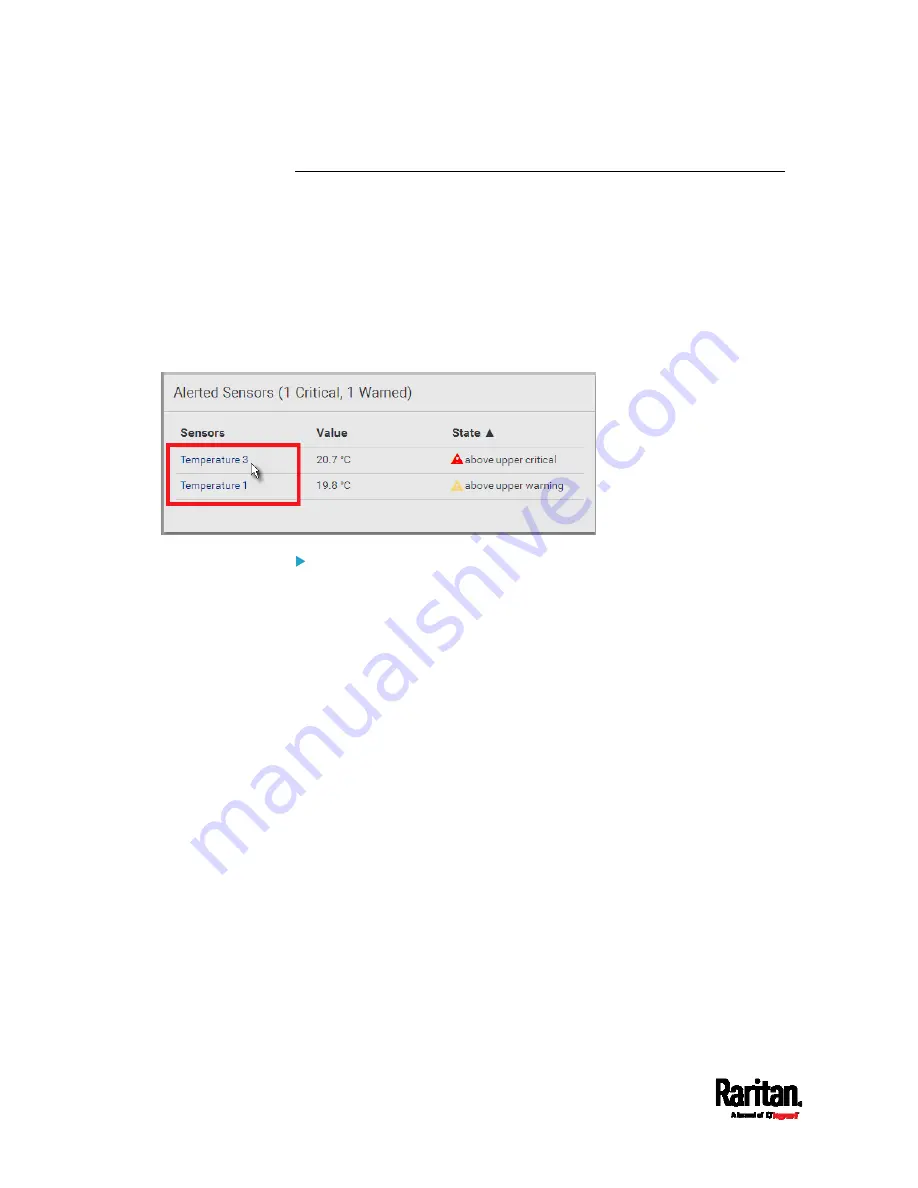
Dashboard - Alerted Sensors
When any internal sensors or environmental sensor packages connected
to the SRC enter an abnormal state, the Alerted Sensors section in the
Dashboard show them for alerting users.
To view detailed information or configure each alerted sensor, you can
click each sensor's name to go to individual sensor pages. See
Individual
Sensor/Actuator Pages
(on page 131).
If wanted, you can resort the list by clicking the desired column header.
See
Sorting a List
(on page 107).
Summary in the section title:
Information in parentheses adjacent to the title is the total number of
alerted sensors.
For example:
1 Critical: 1 sensor enters the critical or alarmed state.
- Numeric sensors enter the critical state.
- State sensors enter the alarmed state.
Summary of Contents for Raritan SRC-0100
Page 114: ...Chapter 6 Using the Web Interface 102...
Page 291: ...Chapter 6 Using the Web Interface 279...
Page 301: ...Chapter 6 Using the Web Interface 289 6 Click Create to finish the creation...
Page 311: ...Chapter 6 Using the Web Interface 299...
Page 312: ...Chapter 6 Using the Web Interface 300 Continued...
Page 625: ...Appendix H RADIUS Configuration Illustration 613 Note If your SRC uses PAP then select PAP...
Page 630: ...Appendix H RADIUS Configuration Illustration 618 14 The new attribute is added Click OK...
Page 631: ...Appendix H RADIUS Configuration Illustration 619 15 Click Next to continue...


