background image

HVM200 Reference Manual

Power Button Operation

2-2

TAKE NOTE 

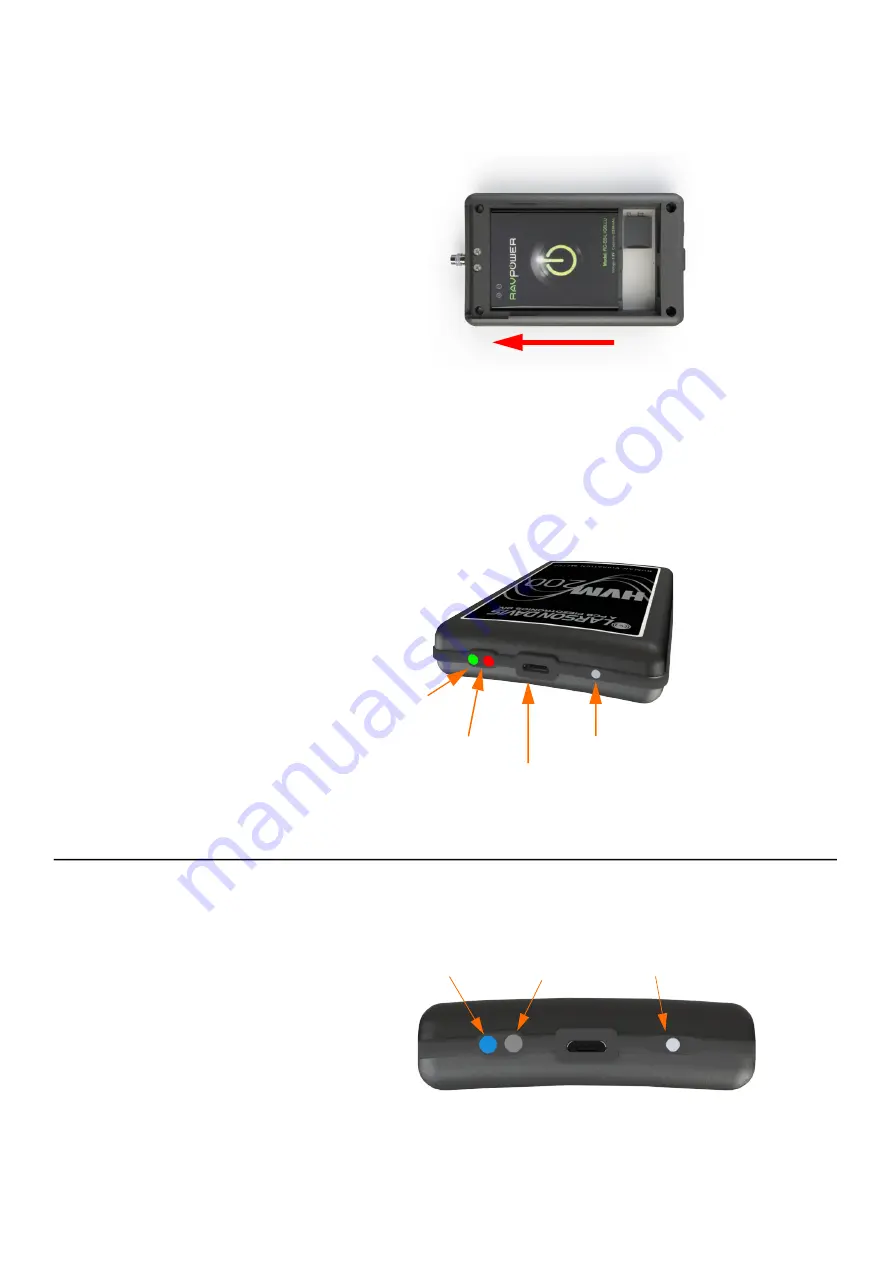
Make sure the battery contacts are fully seated against the power contacts 

in the meter and that the battery lies flat in the tray.

FIGURE 2-1  

Insert Battery

Step 3.  

Slide the back battery cover onto the HVM200.

Step 4.  

Insert one end of the supplied USB cable into the HVM200 Micro-B USB

port and the other end to the PSA035 charger.

TAKE NOTE 

Avoid leaving the battery drained for extended periods of time in order to 

maximize overall battery life. The Power LED displays a yellow color while charging. 

FIGURE 2-2  

HVM200 Communication

2.2  Power Button Operation

The  HVM200  has  one  button,  which  provides  each  of  the  following

functions:

FIGURE 2-3  

HVM200 Power Button

Turn Meter On

Press the 

power

 button until the Power LED shows blue.

Power LED

Status LED

Power Button

Micro-B USB port

The back label of 

your HVM200 

shows the state of 

each LED indicator. 

For more detailed 

information, see 


"LED Indications" 

on page A-3

.

Power Button

Status LED

Power LED

Summary of Contents for HVM200

Page 1: ...Larson Davis HVM200 Reference Manual...

Page 2: ...he information described in this manual may be made at any time Safety If the equipment is used in a manner not specified by Larson Davis the protection provided by the equipment may be impaired HVM20...

Page 3: ...for quick references that fit your needs Each page is drafted on A4 size and can be easily scaled to fit most printers When printing set the scale to Fit to Printable Area FIGURE I 1 PDF View on Adobe...

Page 4: ...anging Features 4 1 4 1 Overview 4 1 4 2 Setting Syncing Meter Time and Date 4 1 4 3 Turning Off On WiFi Signal 4 3 4 4 Upgrade Firmware and Options 4 5 Appendix A Specifications A 1 A 1 General Chara...

Page 5: ...ers Connection and control of multiple meters through WiFi access Support for optional 1 1 and 1 3 Octave Band Analysis Data analysis and visualization using optional G4 LD Utility soft ware 1 2 Stand...

Page 6: ...er and SWW G4 HVM software license 1 2 2 Optional Accessories SWW G4 HVM License to enable HVM100 and HVM200 support in G4 LD Utility HVM200 OB3 1 1 and 1 3 Octave Band Analysis firmware HVM200 RAW Fe...

Page 7: ...s including sensors Adapter Resonance Frequency Response on page B 1 ADP063 ADP080A ADP081A and ADP082A Adapters for accelerometer placement CBL217 05 CBL216 and CBL217 01 Cables for connection betwee...

Page 8: ...Utility via IP Address 2 7 2 7 Connecting the Accelerometer 2 8 2 7 1 Transducer Electronic Data Sheet TEDS 2 9 This module provides instructions for setting up and configuring HVM200 meters for use w...

Page 9: ...void leaving the battery drained for extended periods of time in order to maximize overall battery life The Power LED displays a yellow color while charging FIGURE 2 2 HVM200 Communication 2 2 Power B...

Page 10: ...nd and download the HVM200 Control app from the Google Play 1 Store or the Apple App Store 2 To find the app search for HVM200 2 4 Installing the G4 LD Utility Locate the G4 installer on the Larson Da...

Page 11: ...tiple Mobile Devices FIGURE 2 5 Mobile Connections If a router is within range connect the HVM200 to the same WiFi network as the mobile device s See 2 5 3 Connecting HVM200 to WiFi Network 2 5 2 Conn...

Page 12: ...1 Launch the HVM200 Control app or the G4 Live Stream view Step 2 Select your meter from the list Step 3 Tap the menu icon and select Setup WiFi from the list Step 4 Select an available network TAKE N...

Page 13: ...n the connect screen of the HVM Control App Tap the network name to connect 2 6 Connecting HVM200 to G4 LD Utility G4 LD Utility G4 for HVM software provides features for setup measurement data downlo...

Page 14: ...For more information on working with G4 refer to the G4 LD Utility Software Manual In G4 go to Help Manuals Step 1 Connect the HVM200 to a PC with the provided USB to Micro B cable CBL218 Step 2 Launc...

Page 15: ...see Accelerometer Options A B C and D on page 1 2 Step 1 Insert the accelerometer cable into the 4 pin connector on the HVM200 and then rotate the nut on the cable until the connection is tight Step...

Page 16: ...y values automatically appear on the Sensor tab Step 9 Click Save For future measurements access the Sensor List page to quickly select your configured sensors 2 7 1 Transducer Electronic Data Sheet T...

Page 17: ...app and the G4 LD Utility 3 1 Setting Up the Measurement In this section 3 1 1 Performing a Calibration Check 3 1 2 Selecting a Setup File by Using Your Mobile Device 3 1 1 Performing a Calibration Ch...

Page 18: ...alue Step 7 Repeat the process for each axis on the accelerometer FIGURE 3 2 Calibration Check LEARN MORE If you are using G4 with a license for HVM the last 2 saved calibration checks are displayed i...

Page 19: ...enter a name for the measurement setup FIGURE 3 3 Naming the Setup File TAKE NOTE If you return to the Setup Manager tab from a Settings tab the app prompts you to save settings Click Yes to apply the...

Page 20: ...the Measurement Schedule If needed complete this section to schedule the HVM200 to automatically take a measurement Step 1 Tap the menu icon on the HVM200 app then tap Settings Step 1 Use the arrow in...

Page 21: ...from the Integration drop down specify the k Factor for each axis and enter a Data File Name TAKE NOTE 1 For whole body measurements the HVM200 multiplies the specified k Factor by the instantaneous...

Page 22: ...Arm Vibration For Hand Arm vibration measurement follow these steps Step 1 Attach the Larson Davis CCS048 Arm Band on the person being monitored The end with the transparent cover should be the farthe...

Page 23: ...more information see Power Button Operation on page 2 2 Step 1 In the HVM200 Control app or G4 click or tap the Run button that appears when the meter is connected FIGURE 3 2 Meter is stopped TRY THI...

Page 24: ...ighting MIN and MAX are the minimum and maximum general vibration values represents the summation of vibration values taken from the X Y and Z axes The Summation display provides a real time graphical...

Page 25: ...ORE For information on overload indications on the Status LED see Operational Characteristics on page A 2 An overload occurs when the signal from the accelerometer exceeds the input range of the meter...

Page 26: ...data by using any of the following methods TAKE NOTE Refer to the G4 LD Utility Manual for information on downloading and viewing data with G4 In G4 go to Help Manuals Download and view hvm2 files in...

Page 27: ...from the Data Manager tab This file will always be much larger than an HVM file FIGURE 3 12 Raw Data File In order to work with a raw file you will need MATLAB GNU Octave or similar program The follow...

Page 28: ...s 1 floor num_samples_to_read x_axis A 1 3 end y_axis A 2 3 end z_axis A 3 3 end Remove DC bias from data optional x_axis x_axis mean x_axis y_axis y_axis mean y_axis z_axis z_axis mean z_axis Plot fi...

Page 29: ...ource ISO 8041 on page 14 3 Use the following script and table to adjust the raw data file for hand arm or whole body vibrations isofilwk Sample Code ISO 8041 standard function y isofilwk x fs ISOFILW...

Page 30: ...frequency weightings source ISO 8041 Weighting Band limiting a v transition Upward step Gain f1 Q1 f2 Q2 f3 f4 Q4 f5 Q5 f6 Q6 K Hz Hz Hz Hz Hz Hz Wb 0 4 1 100 1 16 16 0 55 2 5 0 9 4 0 95 1 024 Wc 0 4...

Page 31: ...p Gain f1 Q1 f2 Q2 f3 f4 Q4 f5 Q5 f6 Q6 K Hz Hz Hz Hz Hz Hz NOTE 1 For weighting Wb Table A 1 of ISO 2631 4 2001 rounds the value of parameter Q1 to 2 decimal places The parameter specified here is th...

Page 32: ...C or mobile device 4 1 1 Setting Syncing Time via G4 LD Utility Before you begin Make sure the meter is powered on Launch G4 and connect the HVM200 meter For more information see 2 6 Connecting HVM200...

Page 33: ...time on your mobile device Setting the Meter Time Manually If desired complete these steps instead of using Sync Time a Tap inside the Time field and enter the time b Tap inside the Date field and en...

Page 34: ...ility via USB The USB connection is required for this process Step 1 In G4 go to the Setup WiFi screen Step 2 Click the red power icon in the top left Step 3 G4 displays a WiFi Alert Click Confirm to...

Page 35: ...the drop down menu then click Connect Step 3 In the Upgrading window select Firmware or Options Step 4 Press Choose Firmware File or Choose Options File This opens the File Explorer FIGURE 4 2 Upgrade...

Page 36: ...n Modes Manual Run stop with app or meter button Timed Start at time specified in setup Delayed Start after delay specified in setup of 5 10 20 30 or 60 seconds Clock Calendar 24 hour clock format hh...

Page 37: ...low A 2 Physical Characteristics Dimensions Weight Length 4 6 inches 11 8 cm Width 2 6 inches 6 7 cm Depth 0 7 inches 1 8 cm Weight 4 6 ounces 130 grams including battery Ingress Protection Rating IP4...

Page 38: ...proaches the threshold for safe shut down If the HVM200 shuts down mid measurement the file is truncated and G4 LD Utility may not be able to display summary information for the file Battery Charging...

Page 39: ...cuit was used Measurement Running The HVM200 is in the process of taking a measurement Blinking Measurement Run Pending The HVM200 is stabilizing for an impending measurement which may last up to 60 s...

Page 40: ...tion Measurement input voltage range 1 8 to 16 Vdc Measurement AC reference bias voltage 9 Vdc Absolute voltage range min to max 0 to 28 V Bandwidth 0 4 Hz to 3000 Hz Range Single range Sample rate 71...

Page 41: ...ce Amplitude Vibration Fa 0 4 Hz to 100 Hz Fb 0 4 Hz to 1250 Hz Fc 6 3 Hz to 1250 Hz 50 rad s 7 958 Hz 500 rad s 79 58 Hz 500 rad s 79 58 Hz 10 m s2 10 m s2 10 m s2 Hand Arm Wh 500 rad s 79 58 Hz 10 m...

Page 42: ...how frequency weighting curves for the HVM200 Wk 0 018 0 144 0 073 0 121 5 01 Wm 0 017 0 103 0 060 0 077 5 01 Frequency Weighting Noise Floor typical mV Lower Limit Under range mV Lower Limit Linearit...

Page 43: ...HVM200 Reference Manual A 8...

Page 44: ...HVM200 Reference Manual A 9...

Page 45: ...HVM200 Reference Manual A 10...

Page 46: ...4 10 25 19 2 0 1259 20 12 21 21 2 0 1585 16 19 16 92 2 0 1995 12 34 12 95 2 0 2512 8 71 9 26 2 0 3162 5 51 5 84 2 2 0 3981 3 05 3 15 2 2 0 5012 1 48 1 46 2 2 0 6310 0 65 0 57 1 1 0 7943 0 27 0 17 1 1...

Page 47: ...64 8 65 2 199 5 12 27 12 32 2 251 2 16 11 16 20 2 316 2 20 04 20 16 2 398 1 24 02 24 22 2 Freq Hz Fb Ideal dB Fb Typical dB Tolerance dB 0 1000 24 10 25 24 2 0 1259 20 12 21 23 2 0 1585 16 19 16 94 2...

Page 48: ...02 1 1 50 12 0 00 0 03 1 1 63 10 0 00 0 03 1 1 79 43 0 00 0 00 0 100 0 0 00 0 01 1 1 125 9 0 00 0 04 1 1 158 5 0 00 0 02 1 1 199 5 0 00 0 05 1 1 251 2 0 01 0 06 1 1 316 2 0 02 0 05 1 1 398 1 0 04 0 10...

Page 49: ...943 1 46 1 52 1 18 1 25 2 2 0 06 0 12 1 1 10 00 0 64 0 67 0 43 0 46 1 1 1 41 1 39 1 1 12 59 0 27 0 31 0 38 0 39 1 1 4 22 4 21 1 1 15 85 0 11 0 12 0 96 0 99 1 1 8 22 8 22 1 1 19 95 0 04 0 08 2 14 2 17...

Page 50: ...20 05 20 60 8 71 9 30 8 68 9 28 2 0 3162 16 12 16 58 5 51 5 88 5 47 5 78 2 2 0 3981 12 29 12 67 3 05 3 17 2 98 3 10 2 2 0 5012 8 67 9 04 1 47 1 50 1 37 1 40 2 2 0 6310 5 51 5 76 0 64 0 60 0 5 0 45 1 1...

Page 51: ...eal dB Wk Typ dB Tolerance dB 0 100 24 08 25 22 30 18 31 27 30 11 31 20 2 0 1259 20 09 21 22 26 20 27 28 26 14 27 24 2 0 1585 16 14 16 91 22 27 22 99 22 21 22 98 2 0 1995 12 27 12 92 18 42 19 08 18 37...

Page 52: ...44 17 47 17 48 2 2 100 0 43 01 43 03 3 01 3 01 21 04 21 05 2 2 125 9 47 46 47 51 5 45 5 49 25 50 25 55 2 2 158 5 52 64 52 69 8 64 8 66 30 69 30 73 2 199 5 58 27 58 37 12 26 12 34 36 32 36 42 2 251 2 6...

Page 53: ...HVM200 Reference Manual A 18 For the following charts the valid measurement range for each weighting is shown between the noise floor and the maximum...

Page 54: ...HVM200 Reference Manual A 19...

Page 55: ...HVM200 Reference Manual A 20...

Page 56: ...HVM200 Reference Manual A 21...

Page 57: ...HVM200 Reference Manual A 22...

Page 58: ...HVM200 Reference Manual A 23...

Page 59: ...hted Measured Values RMS and Peak OBA Filter Responses Table A 8 1 1 OBA Filter Responses FIGURE A 4 1 1 Octave Filter Response Summary Graph 1 1 Octave Measurement Range Frequency Hz Maximum Noise Fl...

Page 60: ...HVM200 Reference Manual A 25 FIGURE A 5 1 1 OBA 8 0 Hz Filter Response FIGURE A 6 1 1 OBA 8 0 Hz Filter Response Pass band...

Page 61: ...HVM200 Reference Manual A 26 FIGURE A 7 1 1 OBA 16 0 Hz Filter Response FIGURE A 8 1 1 OBA 16 0 Hz Filter Response Pass band...

Page 62: ...5 0 0142 0 13 5 01 6 3 0 01415 0 13 5 01 8 0 0141 0 13 5 01 10 0 01407 0 13 5 01 12 5 0 01405 0 13 5 01 16 0 01403 0 11 5 01 20 0 01401 0 1 5 01 25 0 014 0 09 5 01 31 5 0 01401 0 085 5 01 40 0 01408...

Page 63: ...HVM200 Reference Manual A 28 FIGURE A 9 1 3 Octave Filter Summary Graph FIGURE A 10 1 3 OBA 0 4 Hz Filter Response...

Page 64: ...HVM200 Reference Manual A 29 FIGURE A 11 1 3 OBA 0 4 Hz Filter Response Pass band FIGURE A 12 1 3 OBA 8 0 Hz Filter Response...

Page 65: ...HVM200 Reference Manual A 30 FIGURE A 13 1 3 OBA 8 0 Hz Filter Response Pass band FIGURE A 14 1 3 OBA 16 0 Hz Center Band Filter Response...

Page 66: ...HVM200 Reference Manual A 31 FIGURE A 15 1 3 OBA 16 0 Hz Filter Response Pass band FIGURE A 16 1 3 OBA 80 0 Hz Filter Response...

Page 67: ...ration containing multiple shocks ISO 2631 2 2003 Evaluation of human exposure to whole body vibration Part 2 Continuous and shock induced vibrations in buildings 1 to 80 Hz ISO 2631 4 2001 Mechanical...

Page 68: ...for the adapters ADP080A ADP081A and ADP082A B 1 Mounting and Installation Details B 1 1 Installing the ADP080A FIGURE B 1 Hand Adapter with SEN04XF Accelerometer B 1 2 Installing the ADP081A FIGURE B...

Page 69: ...ject and exciting it with a modal hammer The responses were measured in x y and z directions using a triaxial accelerometer connected to the test object using the specified adapter A graphic is includ...

Page 70: ...HVM200 Reference Manual B 3 FIGURE B 5 Frequency Response Function X Y and Z B 1 6 ADP081A SEN041 FIGURE B 6 Frequency Response Function X Y and Z...

Page 71: ...HVM200 Reference Manual B 4 B 1 7 ADP082A SEN041 FIGURE B 7 Frequency Response Function X Y and Z...

Page 72: ...time in seconds aw t instantaneous acceleration t Time in seconds The Aeq integration time is from Run to Reset the display is updated once per second RMS Acceleration in Decibels ao reference acceler...

Page 73: ...sure points will be the maximum of the three axes exposure points Running RMS Acceleration LINEAR Integration time in seconds to Observation time The linear Arms integration time is controlled by the...

Page 74: ...d acceleration aw t measured over the entire measurement period from Run to Reset The displayed Amp value is updated once per second Short Term Maximum Peak Peak peak level of the instantaneous weight...

Page 75: ...utilisateur pour actioner cet quipment 47 CFR 15 505 FCC Class B NOTE This equipment has been tested and found to comply with the limits for a Class B digital device pursuant to part 15 of the FCC Ru...

Page 76: ...HVM200 Reference Manual E 1 Appendix E Declaration of Conformity...

Page 77: ...cs division LarsonDavis com P N IHVM200 01 Rev I 2019 PCB Piezotronics Inc Worldwide Corporate Headquarters 3425 Walden Avenue Depew NY 14043 2495 USA Toll free in the US 888 258 3222 Phone 716 926 82...

Reviews: