background image

SignalShark User Manual 


138 

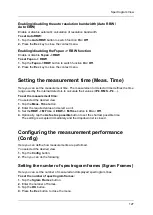
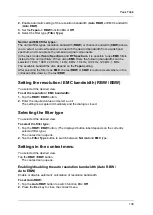
Setting the Rotary Mode 

1.


Tap the 

Rotary Mode 

button. 

2.


Select the required value from the dropdown list and close the list using the 

x

 button. 

Press the 

Esc

 key to close the context menu. 

If Entry Mode is set to Fstart  

Setting the start frequency (Fstart) 

1.


Tap the 

Fstart

 button. 

2.


Enter the required value and select a unit. 

The setting is accepted immediately and the dropdown list is closed. 

Setting the stop frequency (Fstop) 

1.


Tap the 

Fstop

 button. 

2.


Enter the required value and select a unit. 

The setting is accepted immediately and the dropdown list is closed. 

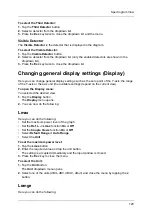
Setting the Auto Fcent trace 

1.


Tap the 

Auto Fcent Trace

 button. 

2.


Select the required value from the dropdown list and close the list using the 

x

 button. 

Selecting the Auto Fcent function 

Tap the 

Auto Fcent 

button. 

Setting the step width (Fstep) 

1.


Tap the 

Fstep

 button. 

2.


Enter the required value and select a unit. 

The setting is accepted immediately and the dropdown list is closed. 

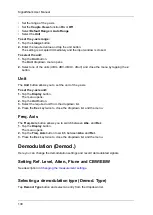
Selecting a transmitter table (Transmitter Tab.) 

1.


Tap the 

Transmitter Tab.

 button. 

2.


Select a transmitter table from the dropdown list and after confirming with 

OK

 the list is 

closed. 

Setting the Rotary Mode 

1.


Tap the 

Rotary Mode 

button. 

2.


Select the required value from the dropdown list and close the list using the 

x

 button. 

Press the 

Esc

 key to close the context menu. 


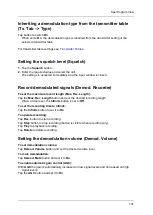
Setting the resolution / EMC bandwidth (RBW / 

EBW) 

Here you can do the following: 

1.


Set the resolution bandwidth (

RBW

) or EMC bandwidth (

EBW

). 

Summary of Contents for Narda SignalShark

Page 1: ...User Manual Version 2019 07 ...

Page 2: ......

Page 3: ...ion 25 About the SignalShark user documentation 25 About this online help 26 User interface language 26 Typographical conventions 26 Control elements 27 User actions 27 About this device 27 Overview of options 28 Antenna handle 28 Narda directional antennas 29 Device Overview 33 Display and control panels 33 3310 Handheld 34 Display and control panels 34 Top side panel with connectors 34 Left side...

Page 4: ... the handle 43 Basic Operation 45 Operation from battery 45 Battery indicators 45 Charging the batteries 46 Changing the batteries 46 Hot swappable features 46 Operation from AC adapter charger 47 Keypad and keyboard 47 Integrated keypad 47 External USB keyboard 47 Switching the device on and off 49 Operating the screen 49 Gestures 49 Locking the touchscreen 49 Button bar 49 Displaying detailed sy...

Page 5: ...ctrum View 76 Available Buttons 77 Setting the reference level attenuation value Ref Level Attenuator 77 Setting the reference level Ref Level 78 Setting the attenuator value Attenuator 78 Selecting the RF input Input 78 Lowering rising the level by 5 dB 5 dB 5 dB 78 Setting the Lmax value 79 Setting the Lrange value 79 Setting the measurement frequency Fcent Fspan Fstart Fstop 80 Selecting the me...

Page 6: ...ner frequency Ftune 95 Setting the tuner frequency Ftune 95 Switching on off the automatic frequency control AFC 95 Switching on off Fcent Ftune 95 Setting the step width Fstep 95 Selecting a Transmitter Table Transmitter Tab 95 Selecting the mode of the rotary wheel Rotary Mode 95 Setting the channel EMC bandwidth CBW EBW 96 Selecting a filter type 96 Setting the resolution EMC bandwidth RBW EBW ...

Page 7: ... the attenuator value Attenuator 108 Selecting the RF input Input 108 Lowering rising the level by 5 dB 5 dB 5 dB 108 Setting the Lmax value 109 Setting the Lrange value 109 Setting the measurement frequency Fcent Fspan Fstart Fstop 110 Selecting the measurement frequency 110 If Entry Mode is set to Fcent 110 If Entry Mode is set to Fstart 111 Setting the resolution EMC bandwidth RBW EBW 111 Setti...

Page 8: ...nge value 123 Setting the measurement frequency Fcent Fspan Fstart Fstop 124 Selecting the measurement frequency 124 If Entry Mode is set to Fcent 124 If Entry Mode is set to Fstart 125 Setting the resolution EMC bandwidth RBW EBW 126 Setting the resolution EMC bandwidth RBW EBW 126 Selecting the filter type 126 Settings in the context menu 126 Setting the measurement time Meas Time 127 Configurin...

Page 9: ...C bandwidth RBW EBW 139 Selecting the filter type 139 Settings in the context menu 139 Setting the measurement time Meas Time 140 Configuring the measurement performance Config 140 Setting the lower and upper frequency limits Lower Freq Lim Upper Freq Lim 140 Setting the threshold Threshold 140 Switching limits on off Limits 140 Setting the scan count number Scan Count 141 Defining the stop behavi...

Page 10: ...uring the north reference North Reference 153 Setting the reference mark direction Ref Mark Dir 154 Configuring the azimuth correction Azimuth Corr 154 Setting the scan count number Scan Count 155 Defining the stop behavior Stop Mode 155 Setting the squelch DF Squelch 155 Setting the minimal stability min Stability 155 Setting the minimum DF quality min DF Quality 156 Setting the Post Avg value 15...

Page 11: ...nge 172 Normal Range 173 Unit 173 Tone 173 Tone Volume 173 Equalizer 173 Spirit Level 173 Demodulation Demod 173 Setting Ref Level Atten Ftune and CBW EBW 173 Selecting a demodulation type Demod Type 173 Inheriting a demodulation type from the transmitter table Tx Tab Type 174 Setting the squelch level Squelch 174 Record demodulated signals Demod Recorder 174 Setting the demodulation volume Demod ...

Page 12: ...sferring map tiles to the SignalShark 191 Selecting a map 192 Zooming in out 192 Selecting a data type 193 Select Ftune 193 Selecting data sets 193 Recording bearings 194 Configuring and starting a localization Localization 194 Configuring localization Config Localization 194 Localize automatically Auto Localize 196 Start localization manually Localize Now 196 Changing general display settings Dis...

Page 13: ... management 205 Updating the operating system 206 Activating Windows 206 Internet security and malware protection 207 Narda Recovery Environment 208 Narda Recovery Stick 209 Related documents 210 Installing Options 211 Updating the firmware 211 Remote Control 213 Legal Disclosure 215 Narda Safety Test Solutions GmbH Software License Agreement 215 Narda Safety Test Solutions GmbH Software License A...

Page 14: ......

Page 15: ...15 Online Help Version 2019 07 ...

Page 16: ......

Page 17: ... shows a full battery and the AC adapter charger switches to trickle charge mode See also Operation from battery Changing the batteries Connecting to power supply system Before the first use the batteries of the SignalShark have to be charged The AC connection is not recommended for general use as the measurement characteristics can be significantly affected by the presence of the power supply cab...

Page 18: ...e that the red mark on the control cable plug is aligned with the notch on the control connector socket show figure 2 Press the control cable plug into the control connector socket using the locking sleeve until the plug lock clicks into place 3 Place the N connector of the handle into the N connector of the basic unit 2 and tighten the coupling nut slowly and without tilting Connecting the antenn...

Page 19: ...e key for a few seconds The device switches off To force shutdown Press and hold down the key for at least 10 seconds to switch off the device immediately without shutting down the operating system properly Screen overview Basic measurement screen with night color scheme and two views RT Spectrum Spectrogram 1 System information This area shows system information like date time and battery status ...

Page 20: ...SignalShark 3310 Handheld provides a resistive touchscreen allowing an easy and fast access The SignalShark 3320 Remote Unit can be operated by an additional touch screen USB and Display Port or via Remote Desktop Gestures The following types of gestures can be used on the touchscreen screen of the device menu Click Click once Double click Click briefly twice Locking the touchscreen Press the Stea...

Page 21: ...re performed at the same time The creation of a task is the prerequisite for being able to perform a measurement at all To support a wide variety of measurement applications SignalShark provides several task modes Scan Spectrum Mode This mode supports measuring the spectrum with full frequency span of 8 kHz up to 8 GHz within one measurement and a maximum measurement speed of 40 GHz s RT Spectrum ...

Page 22: ...the firmware release and the options included in your software package Measurement Engine or Task Mode View Spectrum Scan RT Spectrum Real Time Auto DF RT Streaming Spectrum RT Peak Table RT Spectrogram RT Persistence RT Level Meter Map Bearing Vita 49 IQ Streaming Managing tasks and views After adding a task you may add additional views to that task and rearrange them to your needs As default eac...

Page 23: ...y or click on the edit tasks icon in the task bar The Tasks menu is displayed in the Button bar 2 Tap the Copy Task button The active task is copied and displayed as a new tab Renaming a task 1 On the keypad press the Tasks key or click on the edit tasks icon in the task bar The Tasks menu is displayed in the Button bar 2 Tap the Rename Task button The Rename Task dialog is opened Enter the new na...

Page 24: ... Views button The ConfigTaskViews menu opens and the already added views are displayed 2 Tap the delete x button of the view to be deleted 3 Tap the Button bar header once to close the configuration menus and tap it again to close the Tasks menu Zooming views in out When using several views within a task you may wish to quickly enlarge a view Just double tap on the title bar of the view The window...

Page 25: ...ike the table of content the index or the search function to quickly get access to the needed information 2 Click the Close Help button in the top bar of the Online help to close the help window When closing the help window the screen is set back to operation mode Command Reference Guide The device can be remote controlled by SCPI commands All remote commands can be found in the Command Reference ...

Page 26: ... by SCPI commands All remote commands can be found in the Command Reference Guide which is available as a PDF document To open the PDF now click here To download the PDF from the Narda web site customer login needed click www narda sts com About this online help User interface language This operating manual uses English terminology to describe the user interface Typographical conventions Various e...

Page 27: ...ions Press When a key is operated 1 s Click When a button on the touchscreen is clicked once Double click When a button on the touchscreen is clicked twice About this device SignalShark is a flexible platform up to 8 GHz which can be converted by options into three application oriented solutions Real Time Spectrum Analyzer Monitoring Receiver RF Direction Finding Localization System Based on the s...

Page 28: ... the high speed real time spectra to the selected time resolution 3310 95 002 Level Meter Compass Shows channel level as bar graph and compass values 3310 95 003 Persistence of real time Spectrum Displays spectra as level versus frequency Color indicates rate of occurrence Sporadic signals are detected easily 3310 95 004 Automatic DF Antenna Control Bearing View 3310 95 005 Mapping and Localizatio...

Page 29: ...directional antennas Three Narda directional antennas that are specially matched to the SignalShark and which fit the antenna handle are available They cover the frequency range from 20 MHz to 8 GHz A highly sensitive loop antenna is also available as an accessory for covering the lower frequency range from 9 kHz to 30 MHz You can of course also use directional or omnidirectional antennas from oth...

Page 30: ...hark User Manual 30 Figure Directional antenna 1 frequency range 20 MHz to 250 MHz Figure Directional antenna 2 frequency range 200 MHz to 500 MHz Figure Directional antenna 3 frequency range 400 MHz to 8 GHz ...

Page 31: ...Introduction 31 Figure Loop antenna frequency range 9 kHz to 30 MHz ...

Page 32: ......

Page 33: ... entering values confirming or cancelling entries Keypad is illuminated for operation in dark surroundings 5 LEDs showing the charge status of both batteries and operating status 6 Loudspeaker for clear output of demodulated signal content and the audible signal search tone even in noisy surroundings 7 2 x lithium ion rechargeable batteries The device is protected against moisture penetration IP c...

Page 34: ...ering values confirming or cancelling entries Keypad is illuminated for operation in dark surroundings 5 LEDs showing the charge status of both batteries and operating status 6 Loudspeaker for clear output of demodulated signal content and the audible signal search tone even in noisy surroundings 7 2 x lithium ion rechargeable batteries The device is protected against moisture penetration IP class...

Page 35: ...te control and I Q streaming 7 DC input charge socket 8 3 x RF SMA f input 9 N connector RF N f socket for connecting the antenna 10 Control connector 12 pole socket for connecting the antenna control cable for automatic recognition of Narda antennas and cables 11 10 MHz Ref SMA f input Left side with battery compartment Figure Battery compartments with closed lids and packs pulled out partly ...

Page 36: ...s automatically when connected to the power supply 2 LED to indicate the operating status of the device For more information refer to Displaying the operating status on page 32 3 Stereo jack 3 5 mm headphone jack 4 LEDs indicating the status for remote control and I Q streaming For more information refer to Display the LAN interface status on page 33 5 Product description on the top of the device ...

Page 37: ...ting the antenna control cable 4 10 MHz Ref SMA f input 600 Ohm 5 USB 3 0 connection 6 External GNSS SMA f input 50 Ohm DC voltage for active antenna is supplied 7 Product description including P N S N Mac address 8 Micro SD card slot microSDXC 9 PPS trigger SMA f input 100 kOhm 10 1 GigE connector For remote control I Q streaming and network connection e g the Internet access for Win10 11 DC inpu...

Page 38: ......

Page 39: ...able plug of the handle into the control connector socket on the device 1 making sure that the red mark on the control cable plug is aligned with the notch on the control connector socket show figure 2 Press the control cable plug into the control connector socket using the locking sleeve until the plug lock clicks into place 3 Place the N connector of the handle into the N connector of the basic ...

Page 40: ...the SignalShark is only possible when you use the Narda antenna handle For information about connecting other than directional Narda antennas and non Narda antennas see Connecting cables and antennas from other manufacturers Connecting the handle to the device The antenna handle has a built in cable with two connectors Control connector for power supply and for transmitting the compass data and co...

Page 41: ...ional Narda antennas You can use other antennas from Narda instead of the directional antennas for example if you want to make omnidirectional measurements These antennas can either be attached directly to the instrument or connected to it using a Narda cable Connecting a Narda antenna directly to the device 1 Place the Basic Unit in a vertical position 2 Plug the N connector plug of the antenna o...

Page 42: ...ot detected it is probably not configured The configuration data of the cable can be loaded into the device using removable media e g USB stick To connect a Narda cable to a Narda antenna 1 Plug the N connector on the cable on to the N connector of the antenna 2 Carefully do up the coupling nut on the cable N connector making sure that it is not cross threaded If the nut seems difficult to do up u...

Page 43: ...handle by means of the Antenna Adapter 3100 15 To connect the antenna The configuration data for the antenna have been uploaded 1 Connect the handle to the SignalShark see Connecting the handle to the device 2 Connect the N connector of the third party antenna to the antenna adapter When you do this make sure that the antenna is screwed on to correspond with the polarization direction shown on the...

Page 44: ......

Page 45: ...the battery label Additional batteries can be obtained as accessories Battery indicators Information about the batteries is shown on the keypad and on the screen On the keypad The operating status of the batteries is separately displayed for each battery with 2 LEDs LED lights up red Battery is charging LED lights up green Charging is completed and the AC adapter charger is still connected LED is ...

Page 46: ...shows the charging arrow during the charge cycle When the charge cycle is completed the charge LED on the keypad lights up green the battery symbol on the screen shows a full battery and the AC adapter charger switches to trickle charge mode Changing the batteries Observe the safety instructions for handling batteries given in the document General Safety Information provided with this product Hot ...

Page 47: ... shortcuts when using an external USB keyboard External USB keyboard You may additionally connect an external USB keyboard to comfortably enter characters or navigate through the views Shortcuts allowing access to the functions of the integrated keypad are listed in the last column of the table Connecting a USB keyboard Plug in the USB plug of the keyboard to one of the two USB sockets Table Keys ...

Page 48: ...t press Shift F10 long press Strg Enter double press Move back to a higher menu level 1 Esc Back Open the Tasks menu 3 Shift F11 Open the Marker menu 7 Shift F7 Change volume long press for mute 9 Toggle stop hold a measurement decimal point Shift F12 Save measurement 0 Strg s Short press enter leave num mode Alt n Long press toggle key lock Strg 1 Short press open the online help F1 Long press se...

Page 49: ...een The SignalShark 3310 Handheld provides a resistive touchscreen allowing an easy and fast access The SignalShark 3320 Remote Unit can be operated by an additional touch screen USB and Display Port or via Remote Desktop Gestures The following types of gestures can be used on the touchscreen screen of the device menu Click Click once Double click Click briefly twice Locking the touchscreen Press ...

Page 50: ...n menu the current settings can be viewed only To change settings see Changing general settings Device Information about the SignalShark firmware Options Overview of installed options Batteries Information about the condition of each battery GNSS GNSS information Antenna Data of currently connected selected antenna Antenna Handle Information about the connected antenna handle External Device Curre...

Page 51: ...he underlying measurement engine working mode Within a task all measurements are performed at the same time The creation of a task is the prerequisite for being able to perform a measurement at all To support a wide variety of measurement applications SignalShark provides several task modes Scan Spectrum Mode This mode supports measuring the spectrum with full frequency span of 8 kHz up to 8 GHz w...

Page 52: ...the firmware release and the options included in your software package Measurement Engine or Task Mode View Spectrum Scan RT Spectrum Real Time Auto DF RT Streaming Spectrum RT Peak Table RT Spectrogram RT Persistence RT Level Meter Map Bearing Vita 49 IQ Streaming Managing tasks and views After adding a task you may add additional views to that task and rearrange them to your needs As default eac...

Page 53: ...key or click on the edit tasks icon in the task bar The Tasks menu is displayed in the Button bar 2 Tap the Copy Task button The active task is copied and displayed as a new tab Renaming a task 1 On the keypad press the Tasks key or click on the edit tasks icon in the task bar The Tasks menu is displayed in the Button bar 2 Tap the Rename Task button The Rename Task dialog is opened Enter the new ...

Page 54: ... Views button The ConfigTaskViews menu opens and the already added views are displayed 2 Tap the delete x button of the view to be deleted 3 Tap the Button bar header once to close the configuration menus and tap it again to close the Tasks menu Zooming views in out When using several views within a task you may wish to quickly enlarge a view Just double tap on the title bar of the view The window...

Page 55: ...header of the button bar Available settings Settings Change general device parameters like date time or display brightness All Tasks Set listed measurement parameters related to all tasks Network Set network parameters Transmitter Tables Display and manage transmitter tables Antennas Set antenna configuration parameters ...

Page 56: ...ored data sets records and screenshots Setups Manage your setups In a setup you can store and recall device settings e g tasks and views General settings In the toolbar tap the button To close a menu or view Press the Esc key or tap the header of the button bar Available settings Settings Change general device parameters like date time or display brightness ...

Page 57: ...re and recall device settings e g tasks and views Settings In this menu you can change general device parameters like date time or display brightness Parameter Description Values Date Current date Time Format Time format 12 h 24 h Time Current time Time Zone Time zone see dropdown menu Use Dynamic Daylight Saving Time When set to On automatic switch between daylight saving time summer time and sta...

Page 58: ...source depending on available sources Internal Ant GNSS of the SignalShark External Ant GNSS antenna connected to the SignalShark Dyn Platform Model of internal GNSS Adaption of the internal GNSS to the application Portable Stationary Pedestrian Automotive At Sea Airborne 1g 2g 4g Dyn Platform Model of Antenna GNSS Adaption of the Antenna GNSS to the application Reference Frequency Source Source o...

Page 59: ...n this menu you can set the antenna configuration parameters External Device In this menu you can set the configuration parameters for external devices Cables In this menu you can set the cable configuration parameters Data Logger In this menu you can manage stored data sets records and screenshots For further information see Managing data Setups In this menu you can manage setups In a setup you c...

Page 60: ......

Page 61: ...stem information 2 Toolbar The toolbar gives access to the settings menu and to general functions like forward backward or zoom in out For further information about the toolbar see Toolbar For changing the general settings see Changing general settings 3 Task bar Allows to switch between active tasks 4 5 Task area Graphical and numerical display of measurement values The Task area can contain up t...

Page 62: ...evice status Shows the current date Shows the current time Shows the charge status of each of the batteries Shows that a view from the Data Logger is displayed and not a current measurement Shows that the A D converter is overdriven Shows that GNSS signal is being received Shows that the numbers are active on the numeric block The Num key is lit in blue Touchscreen function has been locked Due to ...

Page 63: ...rouped General settings menu See Changing general settings Data Logger menu In this menu you can manage stored data sets records and screenshots Save button Tap to save the current data set Screenshot camera Tap to get a screenshot from the current display Last next action in history Tapping the dropdown icon opens the action history Run button Tap to start or stop hold a permanent measurement ...

Page 64: ... available buttons depend on the active view The title of the main menu is displayed on top of the Button bar When you have opened a submenu tap the title of that menu to get back to the main menu Buttons in the button bar The buttons show a submenu when tapped Some buttons even may have several submenus To close the submenus tap the header of the Button bar or press the Esc key until Main is disp...

Page 65: ... Time The measurement or detector time defines the time range used by the internal detectors to calculate their values Pk RMS Pk For spectrogram this is the time of one spectrogram line Scan No Number of measurements since starting run Scan Count Number of measurement cycles for one single run This parameter also controls the memory depth of the MxP MxR MnR and MnP traces ...

Page 66: ......

Page 67: ...eft peak from current position Axis Time Set marker to upper peak from current position Right Peak Lower Peak The displayed button depends on the selected axis Axis Freq Set marker to right peak from current position Axis Time Set marker to lower peak from current position Both Axis Select if Next Peak and Peak is related to only one or both axis Next Peak Set marker to next peak from current posi...

Page 68: ...eds see Table 4 To close the Marker Config menu press the Esc key or tap the header of the button bar To fold unfold the Marker Table 1 On the keypad press the Marker key The Marker menu opens 2 In the Button bar tap the Table button on the very bottom of the bar The Marker Table dropdown list is displayed on the very top of the bar 3 Tap on the dropdown list and select an entry All All enabled ma...

Page 69: ...rence 9 Select another tab to change further settings see following topics 10 To close the Marker Config menu press the Esc key or tap the header of the button bar Markers button bar In the Markers button bar following settings are available Tab Select tab in the Marker Config window Marker No Select a marker to be set Enabled Enable disable marker A disabled marker is not displayed but all settin...

Page 70: ...r Ref Referenced marker if marker is set to delta Trace Trace which the marker refers to Freq Link Coupling two markers over the frequency Time Link Coupling two markers over the time Function Function that is referred to the marker FXD Marker The FXD Marker menu allows to set a marker to a fixed frequency time or value ...

Page 71: ...to a peak even if the frequency varies Auto peak Search for M1 Marker 1 always shows highest peak Exclude LO Only frequencies higher than 4 x RBW are evaluated Low frequencies DC portion and mirror frequencies are excluded Peak Excursion Peak Excursion determines what is considered a peak in contrast to noise Use Search Limits Narrow the search range Lower Frequency Set lower frequency limit Upper...

Page 72: ...or from the Marker Configuration menu Setting a marker to delta from the Button bar A delta marker can be defined directly from the Button bar When set from the Button bar only marker 1 can be the referenced marker To select another marker as reference see Setting a marker to delta from the Marker Configuration menu To set a marker as delta marker 1 In the Button bar select a marker The selected m...

Page 73: ...n the marker list changes from M to D Marker 1 is set as reference default To select a reference marker The Marker Config menu is displayed 1 Select a delta marker from the list 2 In the Button bar tap the Ref button A dropdown list opens in the display header 3 Select a marker from the list 4 Tap the header of the Button bar twice to close the menus ...

Page 74: ......

Page 75: ...ns of the device enable you to perform optimum evaluation of the measured values directly on site Marker functions and a peak table are provided for rapid assessment of the results of spectrum analysis You can also display the wideband value of the integrated level for a freely definable frequency band Available Buttons For information about the different types of buttons and how to select them se...

Page 76: ...e can be recorded to give an overview of the detected spectrum or to determine the maximum values in Spectrum view The extended functions of the device enable you to perform optimum evaluation of the measured values directly on site Marker functions and a peak table are provided for rapid assessment of the results of spectrum analysis You can also display the wideband value of the integrated level...

Page 77: ...ce Level is an indirect way to set the current attenuator value It defines the maximum measurable level For better convenience it also sets the upper axis limit of the view You can stop this coupling by setting the entry mode to Abs in the Display settings 1 Tap the header of the desired view 2 Tap the Display button 3 Tap the Freq Axis button and switch between Abs and Rel 4 Press the Esc key twi...

Page 78: ...ter the required value and tap the unit button The setting is accepted immediately and the dialog is closed Or use the Rotary knob to change the value Setting the attenuator value Attenuator You selected the desired view 1 Tap the Attenuator button The settings dialog opens 2 Enter the required value and tap the unit button The setting is accepted immediately and the dialog is closed Or use the Ro...

Page 79: ...Range Select the Unit To set the maximum power level 1 Tap the Lmax button 2 Enter the required value and tap the unit button The setting is accepted immediately and the input window is closed 3 Press the Esc key to close the menu To select the Unit 1 Tap the Unit button The Unit dropdown menu opens 2 Select one of the units dBm dBV dBmV dBuV and close the menu by tapping the x button Setting the ...

Page 80: ...cy Fcent 1 Tap the Fcent button 2 Enter the required value and select a unit The setting is accepted immediately and the dropdown list is closed Setting the frequency span Fspan 1 Tap the Fspan button 2 Enter the required value and select a unit The setting is accepted immediately and the dropdown list is closed Setting the Auto Fcent trace 1 Tap the Auto Fcent Trace button 2 Select the required v...

Page 81: ...t Trace button 2 Select the required value from the dropdown list and close the list using the x button Selecting the Auto Fcent function Tap the Auto Fcent button Setting the step width Fstep 1 Tap the Fstep button 2 Enter the required value and select a unit The setting is accepted immediately and the dropdown list is closed Selecting a transmitter table Transmitter Tab 1 Tap the Transmitter Tab...

Page 82: ...ter type EMC the text RBW or CBW is replaced everywhere in the corresponding views by the text EBW Setting the resolution EMC bandwidth RBW EBW You selected the desired view To set the resolution EMC bandwidth 1 Tap the RBW EBW button 2 Enter the required value and select a unit The setting is accepted immediately and the dialog is closed Selecting the filter type You selected the desired view To ...

Page 83: ...g is accepted immediately and the dropdown list is closed Configuring the measurement performance Config Here you can define how measurements are performed To open the Config menu You selected the desired view 1 Tap the Config button 2 Then you can do the following Setting the number of measurements Scan Count Sets the number of measurements for a single run measurement until the measurement stops...

Page 84: ...elect the traces to be displayed You selected the desired view 1 Tap the Traces button 2 Tap a button to switch the trace On Off 3 Tap the Enable All button to display all traces 4 Tap the Disable All button to hide all traces At least the RMS trace remains on as default 5 To set the third director tap the Third Detector button 6 Press the Esc key to close the menu BACKGROUND There are three main ...

Page 85: ... fade away In this way short pulses for example can be made visible Calculated traces Detector 1 MxP Maximum of Plus Peak Detector 2 MxR Maximum of RMS AvR Average of RMS MnR Minimum of RMS Detector 3 depending on the configuration MnP Minimum of Minus Peak MxA Maximum of Average MxS Maximum of Sample Changing general display settings Display Here you can change general display settings such as th...

Page 86: ... Unit To set the y axis range 1 Tap the Lrange button 2 Enter the required value and tap the unit button The setting is accepted immediately and the input window is closed To select the unit 1 Tap the Unit button The Unit dropdown menu opens 2 Select one of the units dBm dBV dBmV dBuV and close the menu by tapping the x button Unit The Unit button allows you to set the unit of the y axis To set th...

Page 87: ...sc key twice to close the dropdown list and the menu Show Transmission 1 Tap the Display button The menu opens 2 Tap the Show Transmission button and set to On or Off 3 Press the Esc key twice to close the dropdown list and the menu ...

Page 88: ......

Page 89: ...MHz zero span mode Steep filters enable precise separation of adjacent channels The Peak detector values for brief pulsed signals and RMS detector values for variable signals are displayed simultaneously One advantage of Level Meter view is that the measurement is in real time and there are no time gaps Available buttons For information about the different types of buttons and how to select them s...

Page 90: ... e g for monitoring the field strength of a communications channel The channel bandwidth CBW for this can be set in the range 25 Hz to 40 MHz zero span mode Steep filters enable precise separation of adjacent channels The Peak detector values for brief pulsed signals and RMS detector values for variable signals are displayed simultaneously One advantage of Level Meter view is that the measurement ...

Page 91: ...Level Meter View 91 Available buttons For information about the different types of buttons and how to select them see Button bar Tap a button to change setting or to open the submenu ...

Page 92: ...s the maximum measurable level For better convenience it also sets the upper axis limit of the view You can stop this coupling by setting the entry mode to Abs in the Display settings 1 Tap the header of the desired view 2 Tap the Display button 3 Tap the Freq Axis button and switch between Abs and Rel 4 Press the Esc key twice to close the menus Background information about the Reference Level Th...

Page 93: ...the required value and tap the unit button The setting is accepted immediately and the dialog is closed Or use the Rotary knob to change the value Setting the attenuator value Attenuator You selected the desired view 1 Tap the Attenuator button The settings dialog opens 2 Enter the required value and tap the unit button The setting is accepted immediately and the dialog is closed Or use the Rotary...

Page 94: ...Auto Range Select the Unit To set the maximum power level 1 Tap the Lmax button 2 Enter the required value and tap the unit button The setting is accepted immediately and the input window is closed 3 Press the Esc key to close the menu To select the Unit 1 Tap the Unit button The Unit dropdown menu opens 2 Select one of the units dBm dBV dBmV dBuV and close the menu by tapping the x button Setting...

Page 95: ...a unit The settings are accepted immediately and the input window is closed Selecting a Transmitter Table Transmitter Tab 1 Tap the Transmitter Table button 2 Select a table from the dropdown window and confirm with OK For more information about how to create a transmitter table see Transmitter Tables Selecting the mode of the rotary wheel Rotary Mode You can select following modes Digit Fstep cha...

Page 96: ...ter type the label CBW is replaced everywhere in the corresponding views by the label EBW Selecting a filter type You selected the desired view 1 Tap the CBW EBW button The displayed button label depends on the currently selected filter type The context menu opens 2 Tap the Filter Type button and select the desired filter type from the dropdown list 3 Tap the head of the Button bar twice to get ba...

Page 97: ...y the internal detectors to calculate their values Pk RMS Pk To set the measurement time You selected the desired view 1 Tap the Meas Time button 2 Enter the required value and select a unit 3 Press the Esc key twice to close the dialog and the menu Configuring the measurement performance Config Here you can define how measurements are performed You selected the desired view 1 Tap the Config butto...

Page 98: ...etectors menu You selected the desired view 1 Tap the Detectors button The Detectors menu opens 2 Then you can do the following Detector 1 Detector 2 Detector 3 To select the detector types 1 Tap a detector and select from the dropdown menu Detector 1 Pk Off Detector 2 RMS Off Detector 3 Pk Smp Avg Off 2 Press the Esc or OK key to close the dropdown list 3 Press the Esc key to close the menu Mod D...

Page 99: ...selected the Level Meter view 1 Tap the Display and Tone button The menu opens 2 You can now do the following Changing display settings Lmax Here you can do the following Set the zero level of the y axis Set the Entry Mode Absolute or Relative Set the Coupling On Off not available in Level Meter view When coupling is set to On the views of a task are coupled e g the axis To set the zero level 1 Ta...

Page 100: ...it button The setting is accepted immediately and the input window is closed 4 Press the Esc key to close the menu Normal Range The Normal Range button allows you to reset Lmax and Lrange depending on the current Reference Level This is a good starting point for most measurements To set Normal Range 1 Tap the Display and Tone button 2 Tap the Normal Range button Lmax and Lrange are set immediately...

Page 101: ... with OK 4 Press the Esc key to close the menu To select the tone mute function 1 Tap the Display and Tone button 2 Tap the Tone Mute button to switch the function On or Off 3 Press the Esc key to close the menu Equalizer The Equalizer button allows you to switch the equalizer on or off The equalizer adapts the volume according to the tone search tone frequency to get a better sound experience 1 T...

Page 102: ...nsmitter table For transmitter table settings see Transmitter Tables Setting the squelch level Squelch 1 Tap the Squelch button 2 Enter the required value and select the unit The settings is accepted immediately and the input window is closed Record demodulated signals Demod Recorder To set the maximum record length Max Rec Length Tap the Max Rec Length button and set the desired recording length ...

Page 103: ...e Tap Demod Volume button and set the desired volume level To mute demodulation Tap Demod Mute button and set it to On To enable automatic gain control AGC With AGC the gain is automatically increased on low signal levels and decreased on high signal levels Tap the AGC button and set it to On ...

Page 104: ......

Page 105: ... spectrum The colors from blue to green to red indicate the frequency of the occurrence whereby blue is the lowest and red the most frequent value Available buttons For information about the different types of buttons and how to select them see Button bar Tap a button to change setting or to open the submenu ...

Page 106: ...nce View The Persistence View displays the signal level over time using a color spectrum The colors from blue to green to red indicate the frequency of the occurrence whereby blue is the lowest and red the most frequent value Available buttons For information about the different types of buttons and how to select them see Button bar ...

Page 107: ... the upper axis limit of the view You can stop this coupling by setting the entry mode to Abs in the Display settings 1 Tap the header of the desired view 2 Tap the Display button 3 Tap the Freq Axis button and switch between Abs and Rel 4 Press the Esc key twice to close the menus Background information about the Reference Level The sensitivity of the system depends on the input attenuator settin...

Page 108: ... value Attenuator You selected the desired view 1 Tap the Attenuator button The settings dialog opens 2 Enter the required value and tap the unit button The setting is accepted immediately and the dialog is closed Or use the Rotary knob to change the value Selecting the RF input Input To select the RF input 1 Tap the Input button and enter an input 2 Tap the OK button to accept the setting The inp...

Page 109: ...e required value and tap the unit button The setting is accepted immediately and the input window is closed 3 Press the Esc key to close the menu To select the Unit 1 Tap the Unit button The Unit dropdown menu opens 2 Select one of the units dBm dBV dBmV dBuV and close the menu by tapping the x button Setting the Lrange value Here you can do the following Set the range of the y axis Set the Couple...

Page 110: ... Tap the Fcent button 2 Enter the required value and select a unit The setting is accepted immediately and the dropdown list is closed Setting the frequency span Fspan 1 Tap the Fspan button 2 Enter the required value and select a unit The setting is accepted immediately and the dropdown list is closed Switching the Fcent Ftune function on off 1 Tap the Fcent Ftune button to switch it on off Setti...

Page 111: ...pdown list is closed Selecting a transmitter table Transmitter Tab 1 Tap the Transmitter Tab button 2 Select a transmitter table from the dropdown list and after confirming with OK the list is closed Setting the Rotary Mode 1 Tap the Rotary Mode button 2 Select the required value from the dropdown list and close the list using the x button Press the Esc key to close the context menu Setting the re...

Page 112: ...t a unit The setting is accepted immediately and the dialog is closed Selecting the filter type You selected the desired view To select the filter type 1 Tap the RBW EBW button The displayed button label depends on the currently selected filter type The context menu opens 2 Tap the Filter Type button to switch between Normal and EMC type Settings in the context menu You selected the desired view T...

Page 113: ...ce type Pers Type The persistence can be displayed as average or maximum To select the persistence type 1 Tap the Pers Type button to select Avg or Max 2 Press the Esc button to close the menu Setting the scan count number Scan Count Sets the number of counted scans Changing the parameters 1 Tap the button and set the number of scans either by using the rotary control knob or by entering the value...

Page 114: ...ff Select Default Range or Auto Range Select the Unit To set the maximum power level 1 Tap the Lmax button 2 Enter the required value and tap the unit button The setting is accepted immediately and the input window is closed 3 Press the Esc key to close the menu To select the Unit 1 Tap the Unit button The Unit dropdown menu opens 2 Select one of the units dBm dBV dBmV dBuV and close the menu by t...

Page 115: ...robability borders In the diagram the probability with which a signal is detected is represented by colors Dark blue for value selected under Min Probability 0 00001 to 10 Dark red for the value selected under Max Probability 0 0001 to 100 To set Max Probability and Min Probability 1 Tap the Display button 2 Tap the Max Probability or Min Probability button 3 Set the Probability using the Rotary k...

Page 116: ...nsmitter table For transmitter table settings see Transmitter Tables Setting the squelch level Squelch 1 Tap the Squelch button 2 Enter the required value and select the unit The settings is accepted immediately and the input window is closed Record demodulated signals Demod Recorder To set the maximum record length Max Rec Length Tap the Max Rec Length button and set the desired recording length ...

Page 117: ...e Tap Demod Volume button and set the desired volume level To mute demodulation Tap Demod Mute button and set it to On To enable automatic gain control AGC With AGC the gain is automatically increased on low signal levels and decreased on high signal levels Tap the AGC button and set it to On ...

Page 118: ......

Page 119: ...le colors represent the signal level RMS Pk and Pk are available as detectors Detectors compress the high speed real time spectra to the selected time resolution Available buttons For information about the different types of buttons and how to select them see Button bar Tap a button to change setting or to open the submenu ...

Page 120: ... Time Config Detectors Display Demod Spectrogram View The spectrogram allows the display of the signal strength over time of a spectrum while colors represent the signal level RMS Pk and Pk are available as detectors Detectors compress the high speed real time spectra to the selected time resolution ...

Page 121: ... Level RL or Attenuator value Select the RF input Select 5 dB 5 dB Switch Preamp On Off Switch Ext Device On Off Select Unit The Reference Level is an indirect way to set the current attenuator value It defines the maximum measurable level For better convenience it also sets the upper axis limit of the view You can stop this coupling by setting the entry mode to Abs in the Display settings 1 Tap t...

Page 122: ... decouple the reference level and the input attenuator indirectly using the Y Scale Ref parameter in the Display menu Setting the reference level Ref Level You selected the desired view 1 Tap the Ref Level button The settings dialog opens 2 Enter the required value and tap the unit button The setting is accepted immediately and the dialog is closed Or use the Rotary knob to change the value Settin...

Page 123: ... following Set the maximum power level of the graph Set the Ref L Lmax function On or Off Set the Couple Views function On or Off Select Default Range or Auto Range Select the Unit To set the maximum power level 1 Tap the Lmax button 2 Enter the required value and tap the unit button The setting is accepted immediately and the input window is closed 3 Press the Esc key to close the menu To select ...

Page 124: ...se the context menu If Entry Mode is set to Fcent Setting the center frequency Fcent 1 Tap the Fcent button 2 Enter the required value and select a unit The setting is accepted immediately and the dropdown list is closed Setting the frequency span Fspan 1 Tap the Fspan button 2 Enter the required value and select a unit The setting is accepted immediately and the dropdown list is closed Switching ...

Page 125: ...lect a unit The setting is accepted immediately and the dropdown list is closed Switching the Fcent Ftune function on off 1 Tap the Fcent Ftune button to switch it on off Setting the step width Fstep 1 Tap the Fstep button 2 Enter the required value and select a unit The setting is accepted immediately and the dropdown list is closed Selecting a transmitter table Transmitter Tab 1 Tap the Transmit...

Page 126: ...lters the following bandwidths can be selected 10 Hz 100 Hz 200 Hz 1 kHz 9 kHz 10 kHz 100 kHz 120 kHz 1 MHz The available bandwidths also depend on the Fspan setting After selecting the filter type EMC the text RBW or CBW is replaced everywhere in the corresponding views by the text EBW Setting the resolution EMC bandwidth RBW EBW You selected the desired view To set the resolution EMC bandwidth 1...

Page 127: ...e their values Pk RMS Pk To set the measurement time You selected the desired view 1 Tap the Meas Time button 2 Enter the required value and select a unit 3 Set the RBW M Time or EBW M Time button to On or Off 4 Optionally tap the As fast as possible button to set the shortest possible time The setting is accepted immediately and the dropdown list is closed Configuring the measurement performance ...

Page 128: ...nge these parameters 1 Tap the toggle button to select Hold or Stop 2 Press the Esc key or tap the header to close the menu Setting the detectors Detectors Here you can do the following Enable disable the detectors Pk RMS Third Detector detector depends on Third Detector selection Select a third detector Pk Avg Smp Select which of these detectors is displayed in the waterfall diagram To open the D...

Page 129: ...ange of the Y axis or the axis unit the available settings depend on the current view To open the Display menu You selected the desired view 1 Tap the Display button The Display menu opens 2 You can now do the following Lmax Here you can do the following Set the maximum power level of the graph Set the Ref L Lmax function On or Off Set the Couple Views function On or Off Select Default Range or Au...

Page 130: ... To set the y axis unit 1 Tap the Display button The menu opens 2 Tap the Unit button 3 Select the required unit from the dropdown list 4 Press the Esc key twice to close the dropdown list and the menu Freq Axis The Freq Axis button allows you to switch between Abs and Rel 1 Tap the Display button The menu opens 2 Tap the Freq Axis button to switch between Abs and Rel 3 Press the Esc key twice to ...

Page 131: ...ap the Max Rec Length button and set the desired recording length When a time is set the Infinite button is set to Off To set the recording time to infinite Tap the Infinite button to set it to On To operate recording Tap Rec button to start recording Tap Stop button to stop recording button is visible when recording only Tap Play to playback recording Tap Delete to delete recording Setting the de...

Page 132: ......

Page 133: ...133 Peak Table Peak Table View Available buttons For information about the different types of buttons and how to select them see Button bar Tap a button to change setting or to open the submenu ...

Page 134: ...tor Fcent Fspan Fstart Fstop RBW EBW Meas Time Config Traces Display Peak Table View Available buttons For information about the different types of buttons and how to select them see Button bar Tap a button to change setting or to open the submenu ...

Page 135: ...ation about the Reference Level The sensitivity of the system depends on the input attenuator setting This setting is determined by the Reference Level RL parameter High measurement sensitivity avoids falsification of the results due to noise generated internally by the device On the other hand it is important that the device is not overloaded saturated Saturation can also be caused by signals out...

Page 136: ...is closed 3 Press the Esc key to close the context menu Lowering rising the level by 5 dB 5 dB 5 dB 1 Tap the 5 dB or 5 dB button 2 Press the Esc key to close the context menu About the 5 dB 5 dB buttons You can use the 5 dB 5 dB buttons to check for over modulation and to rapidly change the values in 5 dB steps The buttons are only enabled if the change is possible in the selected direction The Y...

Page 137: ...nt 1 Tap the Fcent button 2 Enter the required value and select a unit The setting is accepted immediately and the dropdown list is closed Setting the frequency span Fspan 1 Tap the Fspan button 2 Enter the required value and select a unit The setting is accepted immediately and the dropdown list is closed Setting the Auto Fcent trace 1 Tap the Auto Fcent Trace button 2 Select the required value f...

Page 138: ...o Fcent Trace button 2 Select the required value from the dropdown list and close the list using the x button Selecting the Auto Fcent function Tap the Auto Fcent button Setting the step width Fstep 1 Tap the Fstep button 2 Enter the required value and select a unit The setting is accepted immediately and the dropdown list is closed Selecting a transmitter table Transmitter Tab 1 Tap the Transmitt...

Page 139: ...pe EMC the text RBW or CBW is replaced everywhere in the corresponding views by the text EBW Setting the resolution EMC bandwidth RBW EBW You selected the desired view To set the resolution EMC bandwidth 1 Tap the RBW EBW button 2 Enter the required value and select a unit The setting is accepted immediately and the dialog is closed Selecting the filter type You selected the desired view To select...

Page 140: ... EBW M Time button to On or Off 4 Optionally tap the As fast as possible button to set the shortest possible time The setting is accepted immediately and the dropdown list is closed Configuring the measurement performance Config To change the configuration 1 Tap the header of the desired view 2 Tap the Config button You can set the following parameters Setting the lower and upper frequency limits ...

Page 141: ...e Run key To change these parameters 1 Tap the toggle button to select Hold or Stop 2 Press the Esc key or tap the header to close the menu Editing the peak excursion value Peak Excursion Peak excursion defines the minimum level by which a signal must fall or rise in order to be recognized as a maximum Tap the button and enter the Peak Excursion value Exclude low frequencies Exclude LO If enabled ...

Page 142: ...s Traces Detector 1 Pk Plus Peak Detector 2 RMS Detector 3 The function of the third detector can be set via the context menu as follows Pk Minus Peak Avg Average Smp Sample In order to be able to view very fast signals with the naked eye the measurement time is partly 10 ms there is a downstream compression for these detectors which the user can display as an additional trace The compression time...

Page 143: ... allows you to set the unit of the y axis To set the y axis unit 1 Tap the Display button The menu opens 2 Tap the Unit button 3 Select the required unit from the dropdown list 4 Press the Esc key twice to close the dropdown list and the menu Sort by The Sort by button allows you to select a sorting algorithm 1 Tap the Display button The menu opens 2 Tap the Sort by button to select an option from...

Page 144: ...SignalShark User Manual 144 2 Tap the Other Traces button to switch between Abs and Rel 3 Press the Esc key to close the menu ...

Page 145: ... view For a detailed description how to perform automatic direction finding Auto DF see Performing Automatic Direction Finding For fast and easy frequency settings Ftune is coupled to Fcent of the Spectrum view see Spectrum view CBW defines the relevant channel bandwidth for the bearing In the Spectrum view CBW of the Bearing view is highlighted in blue Available buttons For information about the ...

Page 146: ...d level results localizations can be determined with the Map view The content linked below describes the settings in the Bearing view For a detailed description how to perform automatic direction finding Auto DF see Performing Automatic Direction Finding For fast and easy frequency settings Ftune is coupled to Fcent of the Spectrum view see Spectrum view CBW defines the relevant channel bandwidth ...

Page 147: ...Bearing View 147 Available buttons For information about the different types of buttons and how to select them see Button bar Tap a button to change setting or to open the submenu ...

Page 148: ...ings 1 Tap the header of the desired view 2 Tap the Display button 3 Tap the Freq Axis button and switch between Abs and Rel 4 Press the Esc key twice to close the menus Background information about the Reference Level The sensitivity of the system depends on the input attenuator setting This setting is determined by the Reference Level RL parameter High measurement sensitivity avoids falsificatio...

Page 149: ...ted immediately and the dialog is closed Or use the Rotary knob to change the value Selecting the RF input Input To select the RF input 1 Tap the Input button and enter an input 2 Tap the OK button to accept the setting The input window is closed 3 Press the Esc key to close the context menu Lowering rising the level by 5 dB 5 dB 5 dB 1 Tap the 5 dB or 5 dB button 2 Press the Esc key to close the ...

Page 150: ...s the Esc key to close the menu To select the Unit 1 Tap the Unit button The Unit dropdown menu opens 2 Select one of the units dBm dBV dBmV dBuV and close the menu by tapping the x button Setting the Lrange value Here you can do the following Set the range of the y axis Set the Couple Views function On or Off Select Default Range or Auto Range Select the Unit To set the y axis range 1 Tap the Lra...

Page 151: ...tter Table button 2 Select a table from the dropdown window and confirm with OK For more information about how to create a transmitter table see Transmitter Tables Selecting the mode of the rotary wheel Rotary Mode You can select following modes Digit Fstep changes Ftune by digits or the selected Fstep Fast Tune changes Ftune by rotating the wheel dynamically rotating the wheel long and fast accel...

Page 152: ...er type The context menu opens 2 Tap the Filter Type button and select the desired filter type from the dropdown list 3 Tap the head of the Button bar twice to get back to the main menu or use the Esc key instead Setting the resolution EMC bandwidth RBW EBW You selected the desired view and set the desired filter type 1 Tap the CBW EBW button 2 Set the bandwidth by rotating the rotary knob or ente...

Page 153: ...e to set declination 3 Press the Rotary knob or tap the OK button Configuring the north reference North Reference Bearings are displayed in the polar chart of the Bearing view The angles plotted at the polar chart are the direction relative to a given north reference This north reference can be determined in three ways Compass The ADFA has a built in magnetic compass When Compass is selected the b...

Page 154: ...on and the land mark 4 Calculate the angular difference between this line and the direction to north 5 Enter this value into the parameter button Ref Mark Dir The reference mark direction can also be used for presentations 1 Connect SignalShark to a big screen or beamer 2 Align the ADFA with its notch in the direction of the screen 3 If you now move a transmitter around the ADFA the audience can e...

Page 155: ... DF Squelch parameter will be used as a bearing This parameter can be used to separate strong signals from low ones and to avoid bearings degraded by the noise floor Setting the squelch 1 Tap the DF Squelch button 2 Turn the Rotary knob or enter a value to set direction 3 Press the Rotary knob or tap the OK button Setting the minimal stability min Stability It is important for a correct bearing re...

Page 156: ...Post Avg button 2 Enter the required value and tap the unit button The setting is accepted immediately and the input window is closed Changing display settings Display Here you can change general display settings such as the zero point of the Y axis the range of the Y axis and the axis unit the available settings depend on the current view To open the menu You selected the Bearing view 1 Tap the D...

Page 157: ...1 Tap the Display button 2 Tap the Lrange button 3 Enter the required value and tap the unit button The setting is accepted immediately and the input window is closed 4 Press the Esc key to close the menu Unit The Unit button allows you to set the unit of the y axis To set the y axis unit 1 Tap the Display button The menu opens 2 Tap the Unit button 3 Select the required unit from the dropdown lis...

Page 158: ......

Page 159: ...signal and the reflections that occur The SignalShark automatically calculates the bearing of the signal source based on the horizontally measured values The calculation of the main angle of incidence is performed where possible using a quadratic regression of the measured values obtained Otherwise the azimuth angle of the maximum level is assumed to be the direction of transmission and a message ...

Page 160: ...allows you to more easily see the difference between the received signal and the reflections that occur The SignalShark automatically calculates the bearing of the signal source based on the horizontally measured values The calculation of the main angle of incidence is performed where possible using a quadratic regression of the measured values obtained Otherwise the azimuth angle of the maximum l...

Page 161: ...their compass values to the current scan The system calculates a bearing result with each new value Discrete with Max Hold Same as discrete scan type but only max power level is added to the scan The measurement behavior and the menu structure depends on this setting In most cases the default value Continuous will fit To select a scan type Tap the Scan Type button and select a type from the dropdo...

Page 162: ...etector Display and Tone Demod Tap this button to open the demodulation menu Next step See Step 3 Running and saving a horizontal scan Step 2 Changing the measurement settings Change Settings Here you adapt among other parameters the tuning frequency and the channel bandwidth to the signal of interest ...

Page 163: ... power level Lmax Here you can change the maximum power level settings Lmax 1 Tap the Lmax button 2 Enter the required value and tap the unit button The setting is accepted immediately and the input window is closed 3 Press the Esc key to close the menu Ref L Lmax Sets the reference level as Lmax when set to On Tap to set On or Off Default Range Tap to set the range to the default value Unit 1 Tap...

Page 164: ... can do the following Setting the tuner frequency Ftune You selected the desired view 1 Tap the Ftune button 2 Enter the required value and select a unit The settings is accepted immediately and the input window is closed Switching on off the automatic frequency control AFC Tap the AFC button to switch it on or off Switching on off Fcent Ftune Tap the Fcent Ftune button to switch it on or off Sett...

Page 165: ...ponents Instead of the CBW filter two EMC filters according to the standards CISPR and MIL STD 461 F can be selected When selecting an EMC filter following bandwidths are available CISPR 200 Hz 9 kHz 120 kHz 1 MHz MIL 10 Hz 100 Hz 1 kHz 10 kHz 100 kHz 1 MHz The available bandwidths also depend on the Fspan setting After selecting an EMC filter type the label CBW is replaced everywhere in the corre...

Page 166: ... you can set the measurement time The measurement or detector time defines the time range used by the internal detectors to calculate their values Pk RMS Pk To set the measurement time You selected the desired view 1 Tap the Meas Time button 2 Enter the required value and select a unit Configuring the measurement performance Config Here you can define how measurements are performed 1 Tap the Confi...

Page 167: ... maximum power level of the graph Set the Ref L Lmax function On or Off Select Default Range Select the Unit To set the maximum power level 1 Tap the Lmax button 2 Enter the required value and tap the unit button The setting is accepted immediately and the input window is closed 3 Press the Esc key to close the menu To select the Unit 1 Tap the Unit button The Unit dropdown menu opens 2 Select one...

Page 168: ...ercentage value and confirm with OK 3 Optionally tap the Tone Mute button to switch the tone on off Equalizer Tap this button to switch the Equalizer on off Spirit Level Tap this button to switch the Spirit Level on off Demodulation Demod Here you can change the demodulation settings and record demodulated signals Setting Ref Level Atten Ftune and CBW EBW See description in Changing the measuremen...

Page 169: ...ding Setting the demodulation volume Demod Volume To set demodulation volume Tap Demod Volume button and set the desired volume level To mute demodulation Tap Demod Mute button and set it to On To enable automatic gain control AGC With AGC the gain is automatically increased on low signal levels and decreased on high signal levels Tap the AGC button and set it to On Step 3 Running a horizontal sca...

Page 170: ...in the polar chart by the yellow arrow as well as in the right Calculated column Following figures are calculated Azimuth The direction of the calculated signal Elevation The angle above the horizon Polarization The orientation of the wave e g H 10 means horizontal plus 10 degrees Running a Continuous horizontal scan 1 Tap the Scan Type button and select Continuous from the dropdown list 2 Press t...

Page 171: ...The maximum power level is represented by the orange line in the power level bar Tap the Reset Max button Manually correcting a result Sometimes it may be necessary to manually correct the calculated result e g due to reflections To correct a calculated result You stopped the scan 1 Point the antenna to the wanted direction 2 Tap the Manual Correction button The result is replaced by the current a...

Page 172: ...l 1 Tap the Lmax button 2 Enter the required value and tap the unit button The setting is accepted immediately and the input window is closed 3 Press the Esc key to close the menu To select the Unit 1 Tap the Unit button The Unit dropdown menu opens 2 Select one of the units dBm dBV dBmV dBuV and close the menu by tapping the x button Lrange Here you can do the following Set the range of the y axi...

Page 173: ...lume 1 Tap the Tone Volume button 2 Enter the required percentage value and confirm with OK 3 Optionally tap the Tone Mute button to switch the tone on off Equalizer Tap this button to switch the Equalizer on off Spirit Level Tap this button to switch the Spirit Level on off Demodulation Demod Here you can change the demodulation settings and record demodulated signals Setting Ref Level Atten Ftun...

Page 174: ...h Tap the Max Rec Length button and set the desired recording length When a time is set the Infinite button is set to Off To set the recording time to infinite Tap the Infinite button to set it to On To operate recording Tap Rec button to start recording Tap Stop button to stop recording button is visible when recording only Tap Play to playback recording Tap Delete to delete recording Setting the...

Page 175: ...circular arrays it is the result of 1 omnidirectional measurement 9 antenna elements x 4 phase shifters measurements 37 power measurements The filter settling time equals the minimum configurable measurement time The minimum configurable measurement time depends mainly on the current CBW settings Cycle Time 37 x Meas Time 37 x filter settling time In general Broader CBWs allow shorter cycle times ...

Page 176: ...ection Finding step by step The following recommended steps will lead you through the direction finding process on a most direct way possible and without too many trial and error If you are already familiar with automatic direction finding you can of course skip the individual steps and make the settings directly in the Bearing view Step 1 Creating an Auto DF task and adding views Step 2 Identifyi...

Page 177: ... all four power measurements for a single antenna element 2 The signal to noise ratio is sufficiently high during the entire bearing measurement time 3 The angle of arrival does not change during the entire bearing measurement time The SignalShark simplifies localization of transmitters by autonomously evaluating all the available bearing results and plotting them on a map It uses a statistical di...

Page 178: ...under investigation can conveniently be measured with the SignalShark using the occupied bandwidth spectrum marker function Step 3 Using Spectrum view In the Spectrum View you can monitor the signal to be located as well as it s spectral environment during the DF process This feature is useful to detect any RF frontend overload during the DF process The SignalShark automatically detects any overlo...

Page 179: ...out Spectrum view in Auto DF A central monopole is used as a reference element for DF and as an omnidirectional monitoring antenna This allows monitoring of the adjacent signals around the signal of interest using a Spectrum view while direction finding As a view within the Auto DF task Fcent is coupled to Ftune of the Bearing view ...

Page 180: ...ept in mind for the remaining parameter settings Clearly signals that are received at constant and sufficient power and with a constant AoA fulfill all three conditions Care must be taken to ensure that all three conditions are met if the received power or AoA varies with time The measurement time spent on each power measurement in a bearing cycle is an adjustable parameter on the SignalShark User...

Page 181: ...ch should be set to a value of at least 10 dB above the noise floor and the required level stability value should be set to about 1 dB Using these settings it can be proven that SignalShark only uses bearing cycles for DF that are entirely within a burst transmission when the following two conditions are met The minimum burst length is greater than two bearing cycle times plus one measurement time...

Page 182: ...its reference direction However it is desirable to determine the AoA relative to geographic north for localization purposes There are several ways to achieve this The SignalShark has three North Reference settings for bearings Ref Mark Dir Compass and GNSS velocity Ref Mark Dir Use of the reference mark direction is the most precise method This is somewhat time consuming so it should be employed o...

Page 183: ...nt before reaching the parked position If this is not the case the north reference will need to be changed to Compass when the vehicle is parked The DF antenna must then also be unmounted from the vehicle if low bearing uncertainty is required in the fixed position Azimuth Corr If there is a known reference direction mismatch it can be corrected in every North Reference settings by a parameter cal...

Page 184: ...u and define it as Active Working Directory All measurement data including bearings and bearing records will be stored in this directory The currently set Active Working Directory is marked by a green dot in the corresponding folder icon of the TreeView Display settings Center Centers the map to the current GNSS position Current Position Shows the current position on the map On is recommended Curr...

Page 185: ...bly oversized should be selected from the outset By taping on Set Localization Area the visible map section will be used as localization area You can change the area by setting the parameters Upper Border Lower Border Left Border and Right Border After this you have to apply the changed settings be tapping again on Set Localization Area Velocity Squelch The Velocity Squelch parameter is important ...

Page 186: ...have a significant influence on the assumed localization uncertainty which is displayed as an uncertainty ellipse around the estimated position of the transmitter If realistic parameters are entered in the model the ellipse will delineate the area where the transmitter is located with a probability of 95 Resolution The heatmap resolution is factor that relates the heatmap grid to the pixel resolut...

Page 187: ...me time to drive then into the direction of the current hot spot and then drive around the hot spot area and observe the changes in the heat map The transmitter has probably been located if the red area on the heat map is reducing in size and its center is not moving significantly In most cases the estimated transmitter location will anyway converge on the true transmitter location as the drive ti...

Page 188: ...al 188 To stop localization 1 Set Recording to Off 2 Tap Localization Save Location to store the localization result It is also recommended to create a screenshot of the measurement for easy exchange of localization results ...

Page 189: ... Auto DF task For the view to be available in the Auto DF task the view must be added to the task For information about adding a map view to a task see Using Tasks and Views Creating maps Before displaying a map in the Map view the map must be created using the Narda Map Tool and stored at the SignalShark SSD drive For information about creating a map see Creating Maps Available buttons For inform...

Page 190: ...ol NMT Narda is running an own map server that provides open street maps After selecting a desired area tiles for the various zoom levels are downloaded and copied to the SignalShark drive In the Map View the stored maps can be selected from the Select Map menu Downloading map tiles 1 Open Narda Map Tool NMT 2 Click Set selection area 3 Enter coordinates and size e g Pfullingen 48 465454 9 226208 ...

Page 191: ...cting a project and tiles directory and saving the files Transferring map tiles to the SignalShark You can store the generated maps to a USB Stick or micoSD Card with the NardaMapTools Alternatively you can store the map tiles to the data partition D of the SignalShark 1 Open the NMT project directory 2 Compress the project folder Region Region Mapnik to a ZIP File See graphic ...

Page 192: ...SD drive For information about creating a map see Creating Maps To select a map 1 Tap Select Map and choose a map 2 Press the rotary knob or the OK button Zooming in out The zoom feature provides up to 17 zoom levels from a very huge scale lower level to a very detailed view higher level The selected zoom level is displayed in the information bar on the bottom of the display Additionally the map s...

Page 193: ... directory are displayed Bearings Discrete bearings are displayed in the map To select a data type 1 Tap the Data Type button and select an entry from the dropdown list 2 Press the Rotary knob or the OK key Select Ftune This button shows the frequency set in the Spectrum view or in the Bearing view For more information about setting Ftune see Spectrum View or Bearing View Selecting data sets Selec...

Page 194: ...ar map tap Close Record The record can be recalled from the datalogger To recall a record 1 Tap the Recall Record button 2 Select an entry from the dropdown menu and tap OK The record is loaded and displayed on the map Configuring and starting a localization Localization A localization is based on bearings These bearings can be measured manually e g by using the antenna handle and a appropriate an...

Page 195: ...fficient When using a low zoom factor e g 9 a higher resolution would be recommended e g 1 8 to show details even if the display is enlarged for later evaluation To set the value 1 Tap the Resolution button and select a value from the dropdown menu 2 Press the Rotary knob or tap the OK button Velocity Squelch When the ADF antenna is mounted on a vehicle roof the velocity of the vehicle may vary In...

Page 196: ...w When Auto Localize is set to Off localization can and must be started manually For a localization can be calculated a record with bearings must be available To start localization manually 1 In the Map view Main menu recall the record containing the stored bearings 2 In the Localization menu tap the Localize Now button Localization is calculated and displayed as an ellipsis for the uncertainty re...

Page 197: ... button and select a bearing line type from the dropdown menu Arrow The bearing is displayed as an arrow Short The bearing is displayed as a short line Infinite The bearing is displayed as a infinite line Last Bearing Tap button to show or hide last bearing toggle function Loc Result Tap button to show or hide Ftune and coordinates of last localization on top of the map view toggle function min Pr...

Page 198: ......

Page 199: ...move delete and rename directories see Managing folders Copy move delete and rename files see Managing files Set as Working Directory All data is stored to that folder Tap to set the selected folder as your active working directory The current active working directory is marked with a green dot in the folder view Tab Opens a dropdown menu to select a tab from the top bar You may directly tap on on...

Page 200: ...directory where your current results are stored The data logger is organized in 4 data types Data Sets contains stored data sets Records contains stored records Screen Shots contains stored screen shots Demod Records contains stored demodulation records To manage data Tap one of the tabs to select the required data type Available Buttons Organize Data Logger In this menu you can do the following C...

Page 201: ...set as the current setup Delete Deletes the selected highlighted entry To delete several selected entries see Organize Data Logger Delete Configure Save In this menu you can configure how the name is built and which tasks are saved when saving a data set For further information see Configure Save Selecting a directory To select a directory You selected the Data Logger view 1 Tap the Organize Data ...

Page 202: ...rectory to rename 3 Tap the Rename button The Rename dialog opens Enter a new directory name and confirm using OK Copying a directory To copy a directory You selected the Data Logger view 1 Tap the Organize Data Logger button The Organize Data Logger menu opens 2 Tap the directory to copy 3 Tap the Copy button The Copy dialog opens and shows the following options Single Item Selection select items...

Page 203: ... view 1 Tap the Organize Data Logger button The Organize Data Logger menu opens 2 Tap the directory to delete 3 Tap the Delete button The Delete dialog opens and shows the following options Single Item Selection select items individually Several Items Selection select items successively Multiline Selection select all items between active item and tapped item Select All select all available items I...

Page 204: ......

Page 205: ...g system and the firmware D Data This partition contains the measurement and user data i e screen shots measurement data settings The data partition is available via network as shared folder User management There are two user accounts User This is the default windows user for all measurements Password changeme Admin This is the administration user Password changeme Please do not add additional use...

Page 206: ...e an image of your system before the update see Narda Recovery Environment 1 In the Start menu type in Services 2 Double tap Services 3 Scroll down to the item Windows Update and double tap 4 Change Startup type to Manual 5 Press the Apply button 6 Press the Start button Update via Windows update server internet connection required WSUS local Windows update server Download of offline updates Windo...

Page 207: ... Windows Defender See Activating windows defender below Installation of antivirus software The software should be set to on demand scan when making measurements to avoid impairing measurement performance Scanning from a USB stick Some software manufacturers provide antivirus solutions that can be installed on a USB stick and executed from there If this is done please note that the SignalShark uses...

Page 208: ...fected Opening the Narda Recovery Environment Tap on the Narda Recovery Environment icon on the desktop Windows will shutdown within 10 seconds and start the Narda Recovery Environment Following menu is displayed Continue Windows will start normal Shutdown System will shutdown Boot from USB This can be used to boot from the Narda Recovery Stick USB Backup and Recovery This is the backup and recove...

Page 209: ...n stored on the system partition and additionally installed applications including software options will be lost Measurement data is stored on the data partition d and will be not affected by this process Although the Windows license is still valid after the restore process you may want to activate Windows To use the Narda Recovery Stick If the operating system fails to start the system will autom...

Page 210: ...ess bar After the image recovery process is executed successfully the system will reboot and show the measurement application Related documents Windows 10 security overview https technet microsoft com en us itpro windows keep secure windows 10 security guide Security policy settings https technet microsoft com en us itpro windows keep secure security policy settings ...

Page 211: ...the options 1 Double click the option from the windows explorer 2 Select Local installation default and click the arrow on the upper right corner to proceed 3 Accept the Software License Agreement 4 Select deselect options if required and click the arrow to proceed 5 Click Install The selected options are installed 6 Click OK to accept the successful installation information 7 Click Restart to res...

Page 212: ...ick the arrow to proceed 7 Select deselect options if required and click the arrow to proceed 8 Click Install The selected components are installed and the system is configured 9 Click OK to accept the successful installation information and click Restart ...

Page 213: ...controlled by SCPI commands All remote commands can be found in the Command Reference Guide which is available as a PDF document To open the PDF now tap here To download the PDF from the Narda web site customer login needed tap www narda sts com ...

Page 214: ......

Page 215: ... the Software and or Materials except the Licensee s employees or those persons expressly authorized to use the Software by the Licensor or e Make the Software and or Materials available over the Internet or similar networking technology or use the Software and or Materials for hire or rental timesharing service bureau or any other purpose whereby a third party may use have access to or derive ben...

Page 216: ...cess is authorized under this Software License Agreement including any infringement of any third party right through such use b A breach of this Software License Agreement by the Licensee or any Authorized Employee or c Any negligent act or omission by the Licensee any Authorized Employee or any of the Licensee s other employees contractors or agents 5 4 The liability of Narda Safety Test Solution...

Page 217: ... to be bound by the terms and conditions set forth in this end user license agreement EULA If Licensee does not agree to the terms and conditions set forth in this EULA then Licensee must not download install or use the software This Software License Agreement is issued by Narda Safety Test Solutions GmbH Possession of a license entitles the user to use the software within the following provisions...

Page 218: ...the Licensee The local authorized sales partner will replace the media at no charge if the Licensee notifies the local authorized sales partner in writing of the manufacturing defect and returns the defective media within 90 days from the date the local authorized sales partner dispatches it The risk of loss of and title in the media data carrier passes to the Licensee upon its receipt 5 2 Clause ...

Page 219: ...dent of such country without a valid export or import license Please be aware that the Software may contain US Content therefor the Licensee represent and warrant that he is not a citizen of or otherwise located within an embargoed nation including without limitation Iran Syria Sudan Cuba North Korea and that he is not otherwise prohibited under the Export Laws from receiving the Software All righ...

Page 220: ...of them are listed below together with their corresponding open source license The detailed license texts are provided in the following chapters Library Package License Link HDF5 HDF5 Licence https support hdfgroup org HDF5 SZIP Szip License https support hdfgroup org doc_resource SZIP Commercial_szip html FreeRTOS MIT Open Source License http www freertos org NotoSansDisplay hinted NotoSansCJKjp ...

Page 221: ...ED OR IMPLIED In no event shall The HDF Group or the Contributors be liable for any damages suffered by the users arising out of the use of this software even if advised of the possibility of such damage Limited portions of HDF5 were developed by Lawrence Berkeley National Laboratory LBNL LBNL s Copyright Notice and Licensing Terms can be found here COPYING_LBNL_HDF5 file in this directory or at h...

Page 222: ...2001 Science Technology Corporation UNM All rights released Copyright C 2003 Lowell H Miles and Jack A Venbrux Licensed to ICs LLC for distribution by the University of Illinois National Center for Supercomputing Applications as a part of the HDF data storage and retrieval file format and software library products package All rights reserved Do not modify or use for other purposes SZIP implements ...

Page 223: ...development of collaborative font projects to support the font creation efforts of academic and linguistic communities and to provide a free and open framework in which fonts may be shared and improved in partnership with others The OFL allows the licensed fonts to be used studied modified and redistributed freely as long as they are not sold by themselves The fonts including any derivative works ...

Page 224: ... this license does not apply to any document created using the Font Software TERMINATION This license becomes null and void if any of the above conditions are not met DISCLAIMER THE FONT SOFTWARE IS PROVIDED AS IS WITHOUT WARRANTY OF ANY KIND EXPRESS OR IMPLIED INCLUDING BUT NOT LIMITED TO ANY WARRANTIES OF MERCHANTABILITY FITNESS FOR A PARTICULAR PURPOSE AND NONINFRINGEMENT OF COPYRIGHT PATENT TR...

Page 225: ...antial portions of the Software THE SOFTWARE IS PROVIDED AS IS WITHOUT WARRANTY OF ANY KIND EXPRESS OR IMPLIED INCLUDING BUT NOT LIMITED TO THE WARRANTIES OF MERCHANTABILITY FITNESS FOR A PARTICULAR PURPOSE AND NONINFRINGEMENT IN NO EVENT SHALL THE AUTHORS OR COPYRIGHT HOLDERS BE LIABLE FOR ANY CLAIM DAMAGES OR OTHER LIABILITY WHETHER IN AN ACTION OF CONTRACT TORT OR OTHERWISE ARISING FROM OUT OF ...

Page 226: ......

Page 227: ...bandwidth F Fcent Center frequency Fspan Frequency span FXD Fixed see Fixed Marker G GNSS Global Navigation Satellite System General term describing any satellite constellation that provides positioning navigation and timing PNT services on a global or regional basis e g GPS Galileo BeiDou GLONASS M MnP Trace showing minimum of Pk MnR Trace showing minimum of RMS MxA Trace showing maximum of Avg M...

Page 228: ...Time Spectrum Mode RTBW Real time bandwidth S SCPI Standard Commands for Programmable Instruments SCPI is a standardized instruction set that is used to control and program measuring instruments SMA Sub Miniature A Coaxial connector mainly used in the frequency range from 1 GHz to 26 5 GHz Smp Sample Only the first of the FFTs to be condensed is used und no further condensation takes place V VBW V...

Page 229: ...ak Table 128 Persistence 101 Spectrogram 116 Spectrum 71 Entry Mode Level Meter 82 138 Peak Table Fcent Fspan Fstart Fstop 127 Ref Level Attenuator 125 Persistance Display 104 Fcent Fspan Fstart Fstop 100 Ref Level Attenuator 97 Spectrogram Fcent Fspan Fstart Fstop 114 Ref Level Attenuator 111 Spectrum Fcent Fspan Fstart Fstop 70 Ref Level Attenuator 67 F Fcent Peak Table 127 Persistence 100 Spect...

Page 230: ...da Recovery Stick 199 O Operating System 195 Options overview 18 P Peak Table View Configuration 130 Display 133 Overview 123 124 Persistance View Configuration 103 Display 104 Overview 95 96 Protection against malware 197 Q Quick start guide 15 R RBW Peak Table 128 Persistence 101 Spectrogram 116 Spectrum 71 Related documents 200 Remote Control 203 S Screenshot creating 41 Security Internet 197 S...

Page 231: ...231 User actions 16 User documentation 15 User management 195 V Views and Tasks 11 41 W Windows activation 196 Windows Update 196 ...

Reviews: