background image

2

General Power Meter Functions

62

Keysight N8262A User’s Guide

resolution settings are different, the highest resolution setting is taken to calculate 

the averaging number.
These four resolution levels represent:
1, 0.1, 0.01, 0.001 dB respectively if the measurement suffix is dBm or dB.
1, 2, 3 or 4 significant digits respectively if the measurement suffix is W or %.

Procedure

Set measurement averaging as follows:

1

Click 

. Click 

 to select the required channel. The current 

setting is shown in the Meas Avg field (

AUTO

MAN

, or 

OFF

) on the 

Channel 

Setup

 screen. The default is 

AUTO

.

2

Use the 

 and 

 softkeys to select the Filter setting field.

3

Click 

 and use the 

 and 

 to step through the available settings.


If you have selected 

AUTO

 or 

OFF

 proceed at step 7. If you have selected 

MAN


proceed as follows:

4

Use the 

 softkey to select the 

Meas Avg:


value field.

5

Click 

 to display the 

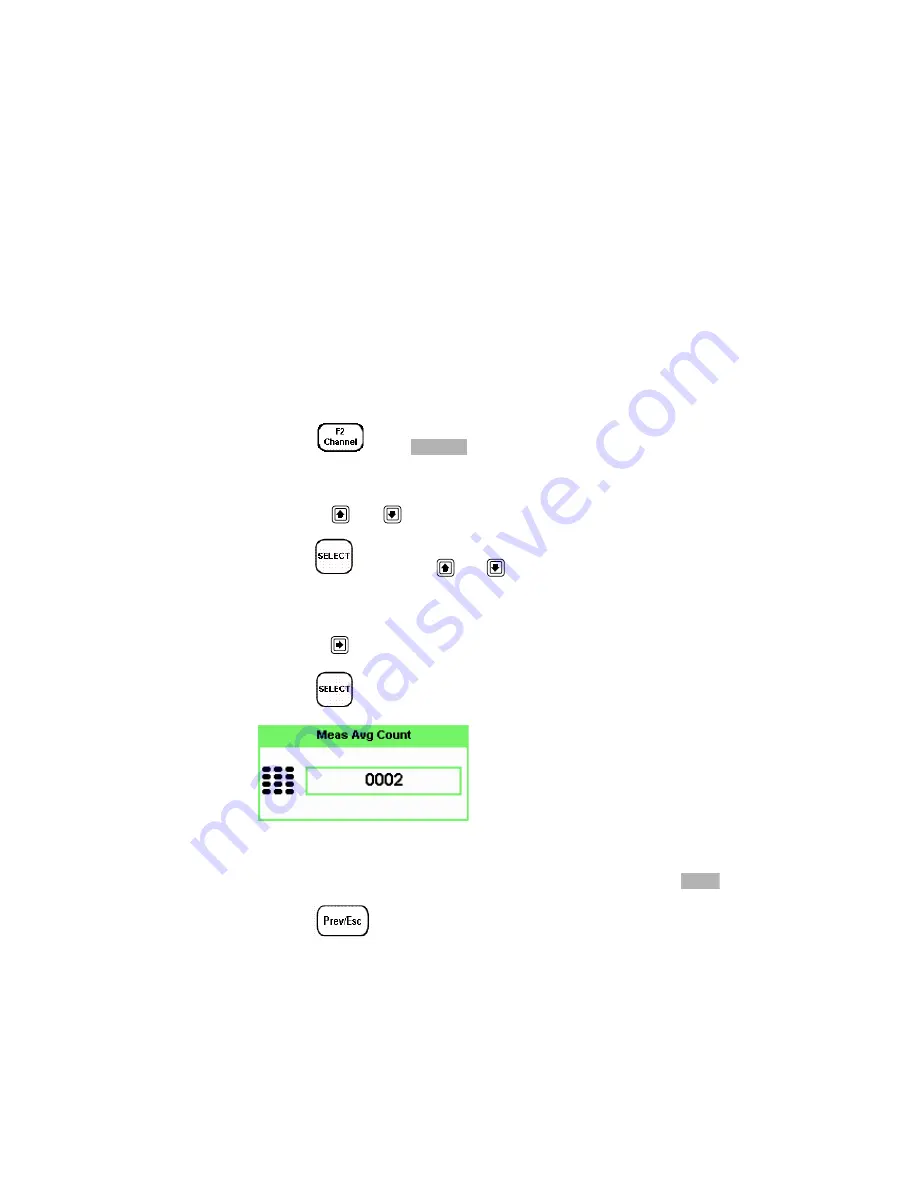
Meas Avg Count


pop-up.

Figure 2-18

Meas Avg Count pop-up

6

Use the numeric softkey pad to enter the required value and click 

.

7

Click 

 softkey to close the 

Channel Setup

 screen.

Channel

Enter

Summary of Contents for N8262A P Series

Page 1: ...Keysight N8262A P Series Modular Power Meter User s Guide ...

Page 2: ...customarily provided to the public to use modify reproduce release per form display or disclose commercial computer software or commercial com puter software documentation No additional government requirements beyond those set forth in the EULA shall apply except to the extent that those terms rights or licenses are explicitly required from all providers of commercial computer software pursu ant t...

Page 3: ...or for incidental or consequential damages in connection with the furnishing use or performance of this document or any information contained herein Should Keysight and the user have a separate written agreement with warranty terms covering the material in this document that conflict with these terms the warranty terms in the separate agreement shall control Duration and conditions of warranty for...

Page 4: ...yer s circuitry In addition Keysight does not warrant any damage that occurs as a result of the Buyer s circuit or any defects that result from Buyer supplied products To the extent allowed by local law Keysight makes no other warranty expressed or implied whether written or oral with respect to this product and specifically disclaims any implied warranty or condition of merchantability fitness fo...

Page 5: ...ned in FAR 2 101 a or as restricted computer software as defined in FAR 52 227 19 Jun 1987 or any equivalent agency regulation or contract clause whichever is applicable You have only those rights provided for such Software and Documentation by the applicable FAR or DFARS clause or the Keysight standard software agreement for the product involved Technology Licenses The hardware and or software de...

Page 6: ...e switch is pressed To isolate the instrument the mains coupler mains input cord should be removed from the power supply Off mains supply On mains supply Caution risk of electric shock Caution risk of danger refer to this manual for specific Warning or Caution information Earth ground terminal Frame or chassis ground terminal Protective earth ground terminal Equipment protected throughout by doubl...

Page 7: ...r design manufacture and intended use of the instrument Keysight Technologies assumes no liability for the customer s failure to comply with these requirements General safety information This is a Safety Class I instrument provided with a protective earthing ground incorporated in the power cord The mains plug shall only be inserted in a socket outlet provided with a protective earth contact Any i...

Page 8: ... another person capable of rendering first aid and resuscitation is present DO NOT operate damaged equipment Whenever it is possible that the safety protection features built into this product have been impaired either through physical damage excessive moisture or any other reason REMOVE POWER and do not use the product until safe operation can be verified by service trained personnel If necessary...

Page 9: ...th the Canadian ICES 001 Cet appareil ISM est conforme a la norme NMB 001 du Canada The RCM mark is a registered trademark of the Australian Communications and Media Authority This instrument complies with the WEEE Directive 2002 96 EC marking requirement This affixed product label indicates that you must not discard this electrical or electronic product in domestic household waste ...

Page 10: ...onitoring and Control Instrument product The affixed product label is as shown below Do not dispose in domestic household waste To return this unwanted instrument contact your nearest Keysight Service Center or visit http about keysight com en companyinfo environment takeback shtml for more information Sales and Technical Support To contact Keysight for sales and technical support refer to the sup...

Page 11: ...ory Markings 9 Waste Electrical and Electronic Equipment WEEE Directive 2002 96 EC 10 Product category 10 Sales and Technical Support 10 1 Introduction Product Overview 22 Getting Started 23 Power Meter and Sensor Capability 23 Specifications 23 Conventions Used in this Guide 24 P Series Soft Front Panel Keys and Connections 25 The Display Layout 30 Window Symbols and Pop ups 38 Warning symbol pop...

Page 12: ...e Levels 48 Setting Offsets 51 Setting channel offsets 51 Setting display offsets 53 Setting frequency dependent offsets 54 Editing frequency dependent offset tables 57 Setting Measurement Averaging 61 Step Detection 63 Setting the Video Averaging 64 Setting the Video Bandwidth 66 Setting Measurement Channel Gates 69 Setting up the Channel Trace 72 Setting the Trigger 76 Setting Measurement Limits...

Page 13: ...etting the Trace Display 110 Step 1 Connecting the power sensor 111 Step 2 Setting the channel frequency 111 Step 3 Setting the trigger 112 Step 4 Setting the display to trace 112 Step 5 Expanding the trace display 113 Gate control in a single enlarged window 114 Viewing the results in a full screen window 118 Improving the accuracy with additional settings 119 Complementary Cumulative Distributio...

Page 14: ...tenance 138 Contacting Keysight Technologies 139 Before calling Keysight Technologies 139 Check the basics 139 Instrument serial numbers 140 Erasing Memory Data 142 Returning Your Power Meter for Service 143 Packaging the power meter for shipment 143 5 Characteristics and Specifications ...

Page 15: ...figuration screen 48 Figure 2 5 Pulse duration measurement between two reference levels 49 Figure 2 6 Trace Ref Lvl 1 pop up 49 Figure 2 7 Trace Ref Lvl 2 pop up 50 Figure 2 8 Pulse Duration Ref Lvl pop up 50 Figure 2 9 Simplified measurement path 51 Figure 2 10 Typical channel offset display 52 Figure 2 11 Channel offset indicator 53 Figure 2 12 Typical display offset display 54 Figure 2 13 Frequ...

Page 16: ...sis pop up 81 Figure 2 39 Limits checking applications 82 Figure 2 40 Limits checking results 82 Figure 2 41 Minimum limit pop up 84 Figure 2 42 Limit failures 85 Figure 2 43 Twelve measurements per channel 86 Figure 2 44 Measurement feed example 87 Figure 2 45 Measurement Setup showing single configuration 88 Figure 2 46 Function pop up 88 Figure 2 47 Measurement type pop up 89 Figure 2 48 Gating...

Page 17: ... in single enlarged window 113 Figure 3 4 Trace display with gate control menu 114 Figure 3 5 Trace display with trigger delay menu 115 Figure 3 6 Trace display with trace control menu 117 Figure 3 7 Trace display in full screen 118 Figure 3 8 P Series power sensor default channel setup 119 Figure 3 9 Channel offset display 120 Figure 3 10 CCDF table in windowed display 123 Figure 3 11 CCDF table ...

Page 18: ...18 Keysight N8262A User s Guide THIS PAGE HAS BEEN INTENTIONALLY LEFT BLANK ...

Page 19: ...2 1 Measurement units Single channel measurement 42 Table 2 2 Measurement units Dual channel measurement 42 Table 2 3 P Series sensor video bandwidth setting 66 Table 2 4 Range of values for window limits 83 Table 2 5 Ranges of recorder output setting 96 ...

Page 20: ...20 Keysight N8262A User s Guide THIS PAGE HAS BEEN INTENTIONALLY LEFT BLANK ...

Page 21: ...wer Meter and Sensor Capability 23 Conventions Used in this Guide 24 P Series Soft Front Panel Keys and Connections 25 The Display Layout 30 Window Symbols and Pop ups 38 This chapter introduces you to the Power Meter GUI known as P Series Soft Front Panel in this guide and display of the P Series Modular Power Meter ...

Page 22: ...anual control over the operation of the power meter This interface is emulated from the P Series Power Meter s soft front panel display where Standard Commands for Programmable Instrumentation SCPI commands exist to access desired functionality N8262A operates with three software Web Browser Interface P Series Soft Front Panel and Synthetic Instrument Finder It offers identical measurement perform...

Page 23: ...apabilities The main differences are as below Specifications The specifications for the power meter are listed in Chapter 5 Specifications and Characteristics starting on page 139 Features P Series N1920 E Series E9300 E Series E4410 8480 Series Average power of CW signal Average power of modulated signal Peak power Cal factors stored on EEPROM 200 readings sec Peak burst average power Time gated ...

Page 24: ...e labeled softkey beside the displayed text Alternatively you can click on the indicated softkey to achieve similar button operation Message This text represents a displayed message Parameter This is used to represent a parameter value or title Channel This User s Guide describes the operation for the dual channel power meter To identify channels on a dual channel meter select a softkey on of eith...

Page 25: ...urement configurations is presented Select an option and click the confirm softkey Click this softkey to select the upper or lower measurement window The selected window is highlighted by a blue line on the right side of the window Any measurement setup you create is performed in the selected window Click this softkey to choose windowed expanded or full screen display of a numeric measurement It a...

Page 26: ...re configured from this menu Click this softkey to access the triggering menu Unless a P Series Sensor is connected all the menu softkeys are disabled grayed out Click this softkey to setup relative measurements or set display offsets Use this softkey to configure the selected measurement Click this softkey to access the measurement display menu You can choose the displayed measurement resolution ...

Page 27: ... option to confirm the command Click to continue that is click the softkey beside the displayed word confirm This softkeys is used when there is a two page menu to be displayed For example a 1 of 2 is displayed beside the softkey indicating the first page of a two page menu Click the softkey to access the next page or second page A 2 of 2 is displayed These softkeys are all associated with the men...

Page 28: ...ues X Scale and Y Scale They are also used to enter text for example table names The arrow softkeys are presented individually as and Click this softkey to select a highlighted field to allow data entry check a checkbox and terminate entry of a popup list Click this softkey to access the zero and calibration menus These softkeys and connectors are associated with the measurement channels and are l...

Page 29: ...ser s Guide 29 Click this softkey to start and stop the acquisition of the measurement Click these softkeys to enter numeric values in the pop up fields for example the offset values To complete the entry use the softkey Key Function ...

Page 30: ...ields indicate ERR for any error conditions that occur or informing you to Please Zero the power sensor 2 The blue highlight on the right hand side of the window shows it is the currently selected measurement display line This measurement line is the Upper Window Upper Measurement 3 The measured channel is shown With a P Series Power Sensor connected and channel in trigger mode the associated gate...

Page 31: ...the softkey displays the next page indicated by 2 of 2 Click the softkey to display the previous menu page 8 The available softkey labels are displayed in these four fields Additionally settings associated with the labeled function are displayed under the label 9 This field displays the menu title For example Channel Setup or click and the Zero Cal menu is displayed NOTE With a P Series Power Sens...

Page 32: ...ws a single enlarged window or a full screen display by pressing The display style is applied to the currently selected window or measurement line 11 The upper window is configured to show a single numeric display 12 The lower window is configured to show an analog meter which displays the measurement result and the meter scaling 13 With a P Series Power Sensor connected the symbol shows the trigg...

Page 33: ...field is empty If the measurement result is less than the minimum limit set Undr Lmt is displayed If the measurement result is more than the maximum limit set Over Lmt is displayed 18 This field displays Ofs if an offset is set 19 This field displays Rng Hld if a range is selected 20 This field displays Dty Cyc if a duty cycle is set 21 The information in this field is displayed on two lines and d...

Page 34: ...el and scaling are displayed The lower window is the selected window 23 The indicates the point on the trace where trigger event occurs NOTE The following trace displays are only available when a P Series Power Sensor is connected 23 22 NOTE Single or continuous triggering or must be selected from the Acqn menu to view a trace window The Acqn menu is accessed by clicking is disabled when is select...

Page 35: ... move the active marker along the trace 26 The highlighted table with the green border shows the time Time and the instantaneous power level Pow of the active marker at the configured point A negative time value indicates a measurement before the trigger point 27 This table shows the time Time and the instantaneous power level Pow of the inactive marker at the configured point 28 The highlighted m...

Page 36: ...when the trigger event occurs whilst shows the delayed trigger point When the two points coincide only the trigger is shown In the example shown in Figure 1 7 the appears ahead of the as a trigger delay of 5 00 µs has been configured placing the measurement trigger before the trigger event You can configure the trigger delay by pressing and entering a numeric value To indicate an off screen trigge...

Page 37: ... and Y trace setup fields Using the or softkeys you can highlight the item and change its value 34 The current settings of the X and Y scale are displayed in this reporting line 35 This table shows 7 automatic time measurements performed on the first complete captured pulse after the trigger The 7 measurements are rise time fall time time to positive occurrence time to negative occurrence pulse pe...

Page 38: ...splay information Red used to display an error Warning symbol pop up The warning symbol is displayed either in a pop up window or directly in the measurement window when such an event occurs A pop up window is displayed for approximately two seconds The text in the pop up window gives details of the warning type for example to indicate that a power sensor has insufficient bandwidth or a previous e...

Page 39: ...p up This type of pop up window is displayed when you need to modify numeric data The numeric softkeys allow you to enter the value Text entry pop up This type of pop up window is displayed when you need to modify alphanumeric data for example table names The up down arrow softkeys increment and decrement the alphanumeric digit that the cursor is currently positioned The left right arrow softkeys ...

Page 40: ...menu and you can either use the up down arrow softkeys for increment and decrement or the numeric softkeys to set the values of the X scale and Y scale List pop up This pop up window is displayed when you are required to select an entry from a list Use the up down arrow keys to highlight your choice Click select to complete the entry ...

Page 41: ... Averaging 61 Step Detection 63 Setting the Video Averaging 64 Setting the Video Bandwidth 66 Setting Measurement Channel Gates 69 Setting up the Channel Trace 72 Setting the Trigger 76 Setting Measurement Limits 82 Setting the Measurement Display 86 Scaling the Analog Display 92 Recorder Output 94 Saving and Recalling Power Meter States 98 Zeroing and Calibrating the P Series Sensor 101 Presettin...

Page 42: ...asurement mode Click Select the unit of measurement from and Display softkeys which cannot be selected in your particular mode of operation are grayed out Units dBm W dB NOTE When the measurement unit is set to Watt W it is possible that negative power results are displayed when measuring low power levels Table 2 1 Measurement units Single channel measurement Measurement mode Relative mode off Rel...

Page 43: ...ower In some cases due to the availability of wide power range the following menu is displayed Clicking or increases or decreases the multiplier shown in front of Clicking after the correct multiplier has been selected confirms the entry mW μW nW 2 of 2 W Increment multiplier Decrement multiplier Cancel Increment Multiplier Decrement Multiplier W W NOTE Invalid display softkeys are grayed out so t...

Page 44: ...rative measurements between signals Procedure Set the measurement frequency as follows 1 Click Click to select the required channel 2 Use the and softkeys to highlight the Frequency value field and click to display the Frequency pop up Use the numeric softkey pad to enter the required value in the Frequency pop up window Figure 2 1 Frequency pop up 3 Confirm your choice by selecting or 4 Click to ...

Page 45: ...1 0 01 0 001 dB respectively if the measurement suffix is dBm or dB 1 2 3 or 4 significant digits respectively if the measurement suffix is W or The default value is 0 01 dB 3 digits To set the resolution on the currently selected window 1 Click The current setting of the resolution is highlighted under the softkey 2 To change this setting click repeatedly until the required resolution setting is ...

Page 46: ...ure 1 Click to display the Measurement Setup menu Figure 2 2 shows a Measurement Setup display and the relative measurement items labeled 2 Select the window you wish to set a reference value on by clicking the softkey The currently selected window measurement is displayed 3 Use the and softkeys to highlight the Relative setting field Figure 2 2 Typical relative measurement display 4 Click to chec...

Page 47: ...inal result value will appear on the right hand side of the Rel check field 8 The relative value displayed under Result field will change as the measured signal varies NOTE If you return the power meter to display the numeric display a Rel symbol will be displayed in the measurement window it is applied to Figure 2 3 Numeric display NOTE The Rel symbol is not displayed when the associated measurem...

Page 48: ... softkey to display the Measurement Configuration screen Click the softkey to select the desired channel Figure 2 4 Measurement configuration screen 1 of 2 Meas Config Channel A B NOTE Trace Ref Lvl 1 and Trace Ref Lvl 2 are used in calculation of transition durations and occurrences NOTE Pulse Duration Ref Lvl allows pulse duration measurements between non standard reference levels ...

Page 49: ...Lvl 1 field 2 Click to display the Trace Ref Lvl 1 pop up and use the numeric softkey pad to enter the intended value in the Trace Ref Lvl 1 pop up window Figure 2 6 Trace Ref Lvl 1 pop up 3 Complete the entry by clicking the softkey 4 Use the and softkeys to highlight the Trace Ref Lvl 2 field Trace Ref Lvl 2 90 Pulse Duration Ref Lvl 50 Measured pulse duration Trace Ref Lvl 1 10 ...

Page 50: ...o highlight the Pulse Duration Ref Lvl field 8 Click to display the Pulse Duration Ref Lvl pop up and use the numeric softkey pad to enter the intended value in the Pulse Duration Ref Lvl pop up Figure 2 8 Pulse Duration Ref Lvl pop up 9 Complete the entry by clicking the softkey NOTE By default the Trace Ref Lvl 1 Trace Ref Lvl 2 and Pulse Duration Ref Lvl settings are set to 10 90 and 50 respect...

Page 51: ...nel individually An overall offset can be applied if required using the Display Offset Setting channel offsets This gain or loss is applied to the measured power before any mathematical functions display offsets or relative functions are included Offsets are entered in dB and the range is 100 dB to 100 dB A positive value compensates for a loss and a negative value compensates for a gain Channel F...

Page 52: ...et setting field 4 Click to check the Offset setting field Figure 2 10 Typical channel offset display 5 Click to highlight the Offset value field and click to display the Offset pop up Use the numeric softkey pad to enter the required value in the Offset pop up window 6 Confirm your choice by clicking 7 Click softkey to complete the offset entry If either a channel or a display offset is set the O...

Page 53: ...or a loss and a negative value compensates for a gain Procedure Enter a display offset on the currently selected window 1 Click to display the Measurement Setup screen 2 Select the window you wish to set the offset value on by clicking the softkey The currently selected window measurement is displayed 3 Use the and softkeys to highlight the Offset setting field 4 Click to check the Offset setting ...

Page 54: ...fsets Frequency dependent offset tables provide a quick and convenient method of compensating for frequency related changes in the response of your test system Note that when selected frequency dependent offset corrections are applied IN ADDITION to any correction for sensor frequency response The power meter is capable of storing 10 frequency dependent offset tables with a maximum of 80 frequency...

Page 55: ...asure The calibration factor offset is automatically set by the power meter from the sensor calibration table if selected and the frequency dependent offset table Refer to Procedure on page 55 for further information 4 Make the measurement Selecting a frequency dependent offset table You can select a frequency dependent offset table from the softkey menu followed by and The State column indicates ...

Page 56: ...t tables display 2 Use the and softkeys to highlight one of the 10 table titles and click to highlight 3 Click to complete the selection of the offset table 4 Click again to display the measurement screen Figure 2 14 shows which offset table is selected Offsets Table On NOTE When no data is contained in the highlighted table the softkey is disabled grayed out Table Done Done Offset table A selecte...

Page 57: ...y are empty of any data when the power meter is shipped from the factory You cannot delete any of the 10 existing frequency dependent offset tables or create any additional tables However you can enter values into the 10 existing tables Each frequency dependent offset table can contain a maximum of 80 frequency points NOTE If the measurement frequency does not correspond directly to a frequency in...

Page 58: ... to edit 2 Rename the table 3 Enter the frequency and offset pairs 4 Save the table Procedure First select the table you want to edit as follows 1 Click to display the Offset Tbls screen 2 Choose the table you want to edit using the and softkeys Click to display the Edit Offset screen as shown in Figure 2 15 Figure 2 15 Edit Offset display with data added Tables Freq Dep Offset NOTE A frequency in...

Page 59: ...w character to the right of the selected character Clicking removes the selected character 4 Click to complete the entry Enter or edit the frequency and offset pairs as follows Change Insert Char Delete Char Enter NOTE The following rules apply to naming sensor calibration tables The name must consist of no more than 12 characters All characters must be upper or lower case alphabetic characters or...

Page 60: ...to enter the required value in the Offset pop up window Complete the entry by pressing the softkey 3 Continue adding editing values until you have entered all the data you require 4 When you have finished editing the table click to save the table Insert Change GHz MHz Change Done NOTE If you measure a signal with a frequency outside the frequency range defined in the frequency dependent offset tab...

Page 61: ... readings averaged together to satisfy the filtering requirements for most power measurements The number of readings averaged together depends on the resolution setting and the power level currently being measured Figure 2 17 Typical averaged readings Figure 2 17 shows the typical number of averages for each range and resolution when the power meter is in auto filter mode and is set to normal spee...

Page 62: ...o select the required channel The current setting is shown in the Meas Avg field AUTO MAN or OFF on the Channel Setup screen The default is AUTO 2 Use the and softkeys to select the Filter setting field 3 Click and use the and to step through the available settings If you have selected AUTO or OFF proceed at step 7 If you have selected MAN proceed as follows 4 Use the softkey to select the Meas Av...

Page 63: ...pon detection of a step increase or decrease in the measured power Step detection can be set in both manual and automatic measurement average modes Procedure Set step detection as follows 1 Click Click to select the required channel 2 Use the and softkeys to select the Step Detect setting field 3 Click to check the step detection to on or off 4 Click softkey to close the Channel Setup screen Chann...

Page 64: ...duce apparent noise The measurement requires a continuously repeating signal Increasing the value of this filter reduces noise but increases the time required to make the measurement Procedure Set the video average as follows 1 Click Click to select the required channel 2 Use the and softkeys to select the Video Avg setting field 3 Click to check the video averaging to on or off 4 Use the softkey ...

Page 65: ...Meter Functions 2 Keysight N8262A User s Guide 65 Figure 2 19 Video Avg Count pop up 6 Use the and softkeys to highlight the required Video Avg Count value and click 7 Click softkey to close the Channel Setup screen ...

Page 66: ...duce the processing speed for long acquisition times The Low Medium and High pass band shapes achieved by the video bandwidth settings provide flat filter responses with very sharp cut off points by applying digital signal processing techniques to ensure accurate power measurement within the specified band NOTE This feature is only available when a P Series Power Sensor is connected Table 2 3 P Se...

Page 67: ...e capture minimizing overshoot and removing any ringing effects caused by the sharp cut off filters used in the Low Med and High settings Figure 2 20 shows the filter shapes associated with the P Series Wideband Power Sensors Procedure Set the video bandwidth as follows 1 Click Click to select the required channel 2 Use the and softkeys to select the Video B W setting field 3 5 dB 5 MHz 15 MHz 30 ...

Page 68: ...Keysight N8262A User s Guide 3 Click to display the Video B W pop up Figure 2 21 Video Bandwidth pop up 4 Use the and softkeys to highlight the required Video Bandwidth setting and click 5 Click softkey to close the Channel Setup screen ...

Page 69: ...an be set up for each channel Figure 2 22 shows an example of 4 gates setup to perform the following measurements simultaneously Average power level of the pulse Gate 1 average measurement Average off power level ahead of the pulse Gate 2 average measurement Peak to average ratio Gate 1 peak to average measurement Pulse drop Gate 3 average measurement minus Gate 4 average measurement Figure 2 22 E...

Page 70: ...ent NOTE This procedure uses the Gates Setup under the Channel Setup menu Alternatively you can use a more visual method when in the Graphical Trace Mode Gate Control Menu to set the channel s Gate Control See Setting the Trace Display on page 100 Gates Setup NOTE The gate start time is relative to the trigger event Positive values set a measurement gate to a maximum time of 1 second after the tri...

Page 71: ...p 3 Complete the entry by clicking the required second millisecond microsecond or nanosecond or softkey 4 Highlight the Gate Length you want to configure using the and softkeys Figure 2 25 Time Gating Length pop up 5 Complete the entry by clicking the required second millisecond or microsecond or nanosecond or softkey 6 Repeat this process until you have setup all the required gates s ms μs ns s m...

Page 72: ...ailable when a P Series Power Sensor is connected NOTE The Trace Setup is the only location where you can change the Y axis units from dBm to Watts NOTE This procedure uses the Trace Setup under the Channel Setup menu Alternatively you can use a more visual method when in the Graphical Trace Mode Trace Control Menu to set the channel s Trace Control See Setting the Trace Display on page 100 Trace ...

Page 73: ...ure 2 27 Trace Start Time pop up 4 Complete the entry by clicking the required second millisecond microsecond or nanosecond or softkey 5 Use the and softkeys to highlight the X Scale field 6 Click to display the X Scale Division pop up a Use the numeric softkey pad to enter the required value in the X Scale Division pop up window b Use the and softkeys to increase or decrease the value Figure 2 28...

Page 74: ...c 9 Click to display the Units pop up and use the and to highlight Watt or dBm Figure 2 29 Trace Units pop up 10 Click to complete the entry 11 Use the and softkeys to highlight the Y Max field 12 Click to display the Trace Maximum pop up and use the numeric softkey pad to enter the required value in the Trace Maximum pop up window Figure 2 30 Y scale maximum value pop up 13 Complete the entry by ...

Page 75: ...the numeric softkey pad to enter the required value in the Y Scale Division pop up window b Use the and softkeys to increase or decrease the value Figure 2 31 Y Scale Division pop up 16 Complete the entry by clicking the or the linear value 17 Click softkey to complete the setup and display the measurements results dB ...

Page 76: ...ered Press The Trigger menu is displayed The trigger status is displayed below the label in the Trigger menu Figure 2 32 shows the power meter display in Free Run mode In this mode the meter is not synchronized to any modulated RF signal at the sensor input Consequently power levels within the configured time gates are random and the displayed measurement results are not valid Figure 2 32 Trigger ...

Page 77: ...onfigure the remaining trigger parameters The trigger Settings menu have 2 pages Figure 2 33 shows page 1 and Figure 2 36 shows page 2 Figure 2 33 Trigger Setting Menu 1 of 2 To help you quickly check the triggering setup the current settings for all the trigger parameters are shown with their respective softkey labels Source The current setting is shown below the label To change the setting press...

Page 78: ...is only available when trigger mode has been selected The current value is shown below the label The minimum power level you can enter is limited to 40 dB below the maximum sensor power To change the setting press and use the numeric softkey pad to enter the required value in the Trigger Level pop up window to enter the new value Figure 2 34 Trigger Level pop up Complete the entry by pressing Dela...

Page 79: ...er delay pop up Complete the entry by pressing the required second millisecond microsecond or nanosecond or softkey Click to display the second menu page Figure 2 36 Trigger setting menu 2 of 2 s ms μs ns NOTE The trigger delay time can also be entered or changed in the Trace Display mode when the Gate Control menu is displayed See Setting the Trace Display on page 100 for further detail 1 of 2 ...

Page 80: ...the setting press and use the numeric softkey pad to enter the required value in the Trigger Holdoff pop up window to enter the new value Figure 2 37 Trigger holdoff pop up Complete the entry by pressing or Hysteresis is only available when trigger mode has been selected The current setting is displayed below the label You can use the hysteresis function to help generate a more stable trigger by p...

Page 81: ...he input power rises above a level equal to the trigger level plus the configured hysteresis value To change the setting press and use the numeric softkey pad to enter the required value in the Trigger Hysteresis pop up window to enter the new value Figure 2 38 Trigger hsyteresis pop up Complete the entry by pressing Output The current setting is displayed below the label A TTL level high is produ...

Page 82: ... difference measurement Figure 2 39 Limits checking applications In this application a swept frequency signal is applied to the input of the Device Under Test The power meter measures the output power The limits have been set at 4 dBm and 10 dBm A fail occurs each time the output power is outside these limits as shown in Figure 2 40 Figure 2 40 Limits checking results OUT Swept Source OUT OUT Devi...

Page 83: ...cedure Set the limits as follows 1 Click to display the Measurement Setup menus 2 Use the and softkeys to highlight the Limits setting field 3 Click to check the Limits setting field 4 Use the softkey to highlight the Minimum Limits value field 5 Click to display the Minimum Limit pop up Table 2 4 Range of values for window limits Window units Maximum Minimum Default maximum Default minimum dB 200...

Page 84: ...ield 8 Click to display the Maximum Limit pop up 9 Use the numeric softkey pad to enter the required value and click 10 Click softkey to close the Measurement Setup screen Checking for limit failures Limit failures are displayed in the appropriate field in the measurement window on the power meter s display as shown in Figure 2 42 dBm dBm NOTE The Limits can be disabled and re enabled by checking ...

Page 85: ...unctions 2 Keysight N8262A User s Guide 85 Figure 2 42 Limit failures This measurement has failed as the result is greater than the set limit level This measurement has failed as the result is less than the set limit level ...

Page 86: ...mplete control of the displayed information The power meter cannot display all 12 or 24 measurements simultaneously Average peak and peak to average ratio are made within each gate period generating possible measurement results per channel as shown in Figure 2 43 Figure 2 43 Twelve measurements per channel Gates 1 to 4 Peak Average Pk to Avg Gate 1 Peak Average Pk to Avg Feed 1 Feed 2 Feed 1 Feed ...

Page 87: ...eed 2 can be displayed Numeric format Configure a measurement displayed in or format as follows Click to select the measurement window or measurement line you want to configure Peak Average Pk to Avg Gate 1 Peak Average Pk to Avg Feed 1 Feed 2 Feed 1 Feed 2 Feed 1 Feed 2 Feed 1 Feed 2 Single Combined Gate 2 Gate 3 Gate 4 Measurement Feeds single or combined 12 24 Measurement Highway Feed 1 Feed 2 ...

Page 88: ...easurement assigned in the upper measurement line of the lower window 1 Use the to highlight the Combination function field 2 Click to display the Function pop up and use the and to highlight Single Figure 2 46 Function pop up 3 Click to complete the entry Gate Field Measurement Field Selected window measurement Function field NOTE The gate field is disabled if trigger acquisition is Free Run ...

Page 89: ...pop up 6 Click to complete the entry 7 Use the to highlight the Gate field 8 Click to display the Gate Number pop up and use the numeric softkey pad to enter the required value in the Gate Number pop up window Figure 2 48 Gating number pop up 9 Click to complete the entry 10 Repeat this process until you have setup all the required gates and measurements 11 Click softkey to complete the setup and ...

Page 90: ...ndow Figure 2 49 Measurement Setup showing combined configuration 1 Use the to highlight the Combination function field 2 Click to display the Function pop up see Figure 2 46 and use the and to highlight Combined 3 Click to complete the entry 4 Use the to highlight the measurement type field Gate Fields Gate fields Selected window measurement Measurement fields Function field Combination field NOT...

Page 91: ...to highlight the Gate field 8 Click to display the Gate Number pop up see Figure 2 48 and use the numeric softkey pad to enter the required value in the Gate Number pop up window 9 Click to complete the entry 10 Repeat this process until you have setup all the required gates and measurements 11 Click softkey to complete the setup and display the measurements results Figure 2 50 Measurement example...

Page 92: ...lick to display the Meter Maximum pop up Figure 2 51 Maximum limit pop up 3 Use the numeric softkey pad to enter the required value and click 4 Click to display the Meter Minimum pop up Figure 2 52 Minimum limit pop up 5 Use the numeric softkey pad to enter the required value and click NOTE Ensure you have highlighted an Analog window Use the or softkeys to select the analog measurement window Cli...

Page 93: ... of the displayed menu an additional menu is available When the pop up is displayed you can press 1 of 2 to access the increment decrement multiplier menu Figure 2 53 Increment and decrement multiplier Use the or to display the required units Click the units softkey to complete the entry Press these keys to select the units required Increment Multiplier Decrement Multiplier xW ...

Page 94: ...rom a source using external leveling Monitor the output power To access the Recorder menu click and enable Rec o p This allows you to switch the Recorder Output signal either on or off The and softkeys allow you to scale the power levels to represent the 1 Vdc maximum and 0 Vdc minimum output voltage of the Recorder Output Procedure Set the recorder output as follows 1 Click to display the Measure...

Page 95: ...8 Use the numeric softkey pad to enter the power level you want to generate a 1 Vdc output in the Recorder Maximum pop up and click 9 Use the softkey to highlight the Recorder Maximum value field 10 Click to display the Recorder Maximum pop up Figure 2 55 Recorder minimum pop up 11 Use the numeric softkey pad to enter the power level you want to generate a 0 Vdc output in the Recorder Minimum pop ...

Page 96: ...ement decrement multiplier menu NOTE The recorder output can be disabled and re enabled by checking the Rec o p setting field NOTE The highest power you are going to measure is used to determine the value which you should set for the Recorder Output maximum setting For example if you are measuring a power less than 1 mW and greater than 100 mW then set the recorder maximum value to 1 mW Table 2 5 ...

Page 97: ...262A User s Guide 97 Figure 2 56 Increment and decrement multiplier Use the or to display the required units Click the units softkey to complete the entry Press these keys to select the units required Increment Multiplier Decrement Multiplier xW ...

Page 98: ...k to display the Save Recall screen as shown in Figure 2 57 Figure 2 57 Save Recall screen 2 Using the and softkeys select an available name from the displayed list To change the name of a register See Chapter 2 Editing a register s name starting on page 99 otherwise click 3 The power meter prompts you to click to proceed NOTE Your power meter has measurement configurations suitable for common wir...

Page 99: ...ired register and click The selected name is displayed in a pop up window Modify this as required Figure 2 59 File name pop up 3 Use and softkeys to modify the character on which the cursor is currently positioned 4 Use or to move to other characters 5 Use and as required 6 To confirm your choice click Recalling a measurement setup 1 Click Save Recall Edit Name Insert Char Delete Char Enter Save R...

Page 100: ...ions 100 Keysight N8262A User s Guide 2 Use the and softkeys to select the required register and click The softkey is disabled grayed out when an unused register is selected Figure 2 60 Recall pop up 3 Click Recall Recall Confirm ...

Page 101: ...omatically zero on the fly while you are using the it Alternatively you can perform a zero at your preference During zeroing a wait symbol is displayed Figure 2 61 Zeroing pop up When the P Series Power Sensor is initially connected to the power meter it automatically performs a Zero and Calibration routine When to Zero Zeroing of the power meter is recommended When a 5 oC change in temperature oc...

Page 102: ... need to connect it to the 1 0 mW Power Reference The power meter can be set to automatically calibrate on the fly while you are using it Alternatively you can perform the calibration manually The reference calibration factor is automatically set for all P Series Power Sensors During calibration the wait symbol is displayed Figure 2 62 Calibration wait pop up Offset and relative settings are ignor...

Page 103: ...red to carry out the manual zero and calibration procedure as follow Click and Click or as required Zero Cal lockout The Zero Cal Lockout facility can help you make sure that a measurement cannot be made until the power meter and sensor combination has been zeroed and calibrated When the Zero Cal Lockout facility is enabled and a sensor is initially connected the message Please Zero and Cal is dis...

Page 104: ...hanges to Please Zero Dual channel meters display channel specific messages when a sensor is connected The Zero Cal Lockout configuration is applied to both channels it cannot be applied to one channel only You can enable and disable the Zero Cal Lockout facility from the System menu or the Cal menu as follow Click or Similarly click or 1 of 2 Must Cal Off On 1 of 3 Must Cal Off On ...

Page 105: ... conditions Click the to display the preset options as shown in Figure 2 64 Figure 2 64 Preset display options The remote addresses the data stored in the sensor calibration tables the calibration table selected and the zeroing and calibration data are not affected by a preset NOTE For all preset states total of two windows are displayed ...

Page 106: ...2 General Power Meter Functions 106 Keysight N8262A User s Guide THIS PAGE HAS BEEN INTENTIONALLY LEFT BLANK ...

Page 107: ...er Meter User s Guide 107 3 Using P Series Power Sensor Introduction 108 Configuring a Power Measurement 109 Setting the Trace Display 110 This chapter describes how to use your P Series Power Sensor with your P Series Modular Power Meter ...

Page 108: ...he power meter and with P Series Wideband Power Sensor continuously samples the RF signal at 100 mega samples per second The instantaneous power of an RF signal can be detected with up to 30 MHz of video 1 bandwidth modulation bandwidth The triggering methods used by the system power meter and sensor enable the continuous measurement of modulated signals or single events A trigger can be taken fro...

Page 109: ...y s Gate Control and Trace Control menus to configure your initial set up as it is a more interactive process and may require less iterations between channel triggering gate and display functions to make a measurement Before configuring the measurements you should have some information about the signal you want to measure For example the following information can help you quickly establish stable ...

Page 110: ...requency 3 Set the Trigger to Continuous 4 Set the Display to Trace 5 Expand window and use the Gate control and Trace control menus to set the gate markers trigger delay and scale 6 When you are satisfied with the configuration you may want to save it for future use See Saving and Recalling Power Meter States on page 89 for further information NOTE The procedure assumes you are starting from a de...

Page 111: ...rating the P Series Sensor on page 92 for further information Connect the sensor to the power source Step 2 Setting the channel frequency 1 Click Click to select the channel you want to configure The Channel Setup screen is displayed 2 Use the and softkeys to highlight the frequency field 3 Click to configure the setting See Setting the Measurement Frequency on page 34 for further information Figu...

Page 112: ...ger menu Click the softkey and select to configure continuous triggering When you have completed the procedure you may return to the Trigger menu later to add more accuracy to the remaining trigger parameters to help you achieve a stable and reliable trigger Step 4 Setting the display to trace Using trace display provides a visual representation of the signal of interest Click to display the Trace...

Page 113: ... example of this display This display type also provides a visual method of setting up the gate trigger delay and trace controls Use the softkey to configure the display from two rectangular windows to a single enlarged window or a full screen display by clicking repeatedly The display style is applied to the currently highlighted window Figure 3 3 Trace display in single enlarged window NOTE When...

Page 114: ...ribed in greater detail in Setting Measurement Channel Gates on page 59 However the following sections are to give you an overview of the control and their impact on the displayed results Figure 3 4 Trace display with gate control menu Gate Clicking scrolls through the 4 gates available for each channel The gate displayed is highlighted below the softkey It is also displayed in the channel gate an...

Page 115: ...ted with the green border represents the active marker also highlighted in green A negative time value indicates a measurement before the trigger point See Figure 3 4 Figure 3 5 Trace display with trigger delay menu TgDel When is selected you can adjust the trigger delay The display changes to remove the gate markers and displays the trigger marker s The indicates when the trigger event occurs whi...

Page 116: ...ng and entering a numeric value in the pop up window Clicking highlights to display the trace markers again Trace Control Click to display the Trace Control menu Setting the trace features are described in greater details in Setting up the Channel Trace on page 62 Trig Delay NOTE Your chosen trigger point is used as the reference point for the timing of all the measurement gates Trig Delay Trig De...

Page 117: ...urrence time to negative occurrence pulse width pulse period pulse repetitive interval and pulse repetitive frequency The current settings of the X and Y scale are displayed on the reporting line above both tables Gate Control Click to display the Gate Ctrl menu Setting the gate features are described in greater details in Gate control in a single enlarged window on page 114 Trace Setting Pulse Pe...

Page 118: ... on the display You can click or to display the results as set in Single Enlarged Window mode The current settings of the X and Y scale are displayed on the reporting line above the results You need to toggle the softkey to allow the softkeys to be displayed Figure 3 7 Trace display in full screen Trace Meas Gate Meas Scale Settings Rising and Falling Edge Pulse Width Pulse Period Pulse Repetitive...

Page 119: ... channel you want to configure The Channel Setup screen is displayed Figure 3 8 P Series power sensor default channel setup Use the and softkeys to highlight the setting field and click to configure the setting For further detail on these settings refer to the appropriate sections Meas Avg Setting Measurement Averaging on page 51 Video Avg Setting the Video Averaging on page 54 Step Detect Step De...

Page 120: ...nel Offsets on page 41 FDO Table Setting Frequency Dependent Offsets on page 44 Trigger Setup Press The Trigger menu is displayed The trigger status is displayed below the label in the Trigger menu Click the softkey and add more accuracy to the remaining trigger parameters for example hold off and hysteresis to help you achieve a stable and reliable trigger Hence this ensures that the gates you ha...

Page 121: ...r the appropriate section Feed1 2 Setting the Measurement Display on page 76 Offset Setting Display Offsets on page 43 Limits Setting Measurement Limits on page 72 Display Click The Display Form menu is displayed Choose the display format to present the measurements results The options other than trace are as follows Single Numeric If you need to configure the numeric format when using a P Series ...

Page 122: ...signals to the RF designers by using CCDF This helps avoid costly errors at system integration time Similarly system manufacturers can avoid ambiguity by completely specifying the test signal parameters to their amplifier suppliers CCDF apply to many design applications Some of these applications are Visualizing the effects of modulation formats Combining multiple signals via system s components f...

Page 123: ... User s Guide 123 Windowed CCDF table The CCDF table is shown in windowed format by default Figure 3 10 CCDF table in windowed display Expanded CCDF table Click once for an expanded view of the CCDF table Figure 3 11 CCDF table in expanded display ...

Page 124: ...3 Using P Series Power Sensor 124 Keysight N8262A User s Guide Full Screen CCDF table Click twice for a full screen view of the CCDF table Figure 3 12 CCDF table in full screen display ...

Page 125: ...125 4 Maintenance Self Test 126 Error Messages 129 Operator Maintenance 138 Contacting Keysight Technologies 139 Erasing Memory Data 142 Returning Your Power Meter for Service 143 This chapter describes the built in tests error messages and general maintenance ...

Page 126: ...t panel selection of Self Tests Click to access the Self Test menu consisting of the Instrument Self Test Instrument Self Test If is selected the following tests are run These are the same tests which are run using the TST command Test Point Voltages Calibrator Fan Battery Channel Peak Path Channel CW Path Channel DAP Check As each test takes place the name of the test is listed on the screen Whil...

Page 127: ...IEEE 488 1 compliant standard command TST is used This command runs a full self test and returns one of the following codes 0 no tests failed 1 one or more tests failed Done NOTE Unterminated Query and Hardware Missing error messages will be logged during self test Unterminated Query will be logged if the system is busy processing and no response to P Series Soft Front Panel application Hardware M...

Page 128: ...e name of the test As each stage of the test is completed the message Testing is replaced by either the message Passed or Failed Test descriptions This section specifies what is actually checked by each of the tests Some of the tests may only be applicable to one method of invocation for example from the soft front panel If this is the case it is specified in the test description Most of the tests...

Page 129: ...ine at the top of the display In addition the errors are also written to the error queue If there are any errors in the error queue the soft front panel error indicator is displayed as shown in Figure 4 2 Other errors can also be generated when the power meter is being operated over the remote interface These errors also display the error indicator and are written to the error queue Figure 4 2 Err...

Page 130: ...he queue overflows the most recent error is discarded When the errors are read they are removed from the error queue This opens a position at the end of the queue for a new error message if one is subsequently detected When all errors have been read from the queue further error queries return 0 No errors To delete all the errors in the queue from the front panel click Click and use To delete all t...

Page 131: ...nd string 108 Parameter not allowed More parameters were received than expected for the command You may have entered an extra parameter or added a parameter to a command that does not accept a parameter For example CAL 10 109 Missing parameter Fewer parameters were received than expected for the command You omitted one or more parameters that are required for this command For example AVER COUN 112...

Page 132: ... suffix For example SENS FREQ 200KZ 134 Suffix too long A suffix used contained more than 12 characters For example SENS FREQ 2MHZZZZZZZZZZZ 138 Suffix not allowed A suffix was received following a numeric parameter which does not accept a suffix For example INIT CONT 0Hz 148 Character data not allowed A discrete parameter was received but a character string or a numeric parameter was expected Che...

Page 133: ...nit ignored Indicates that a request for a measurement initiation was ignored as the power meter was already initiated For example INIT CONT ON INIT 214 Trigger deadlock TRIG SOUR was set to HOLD or BUS and a READ or MEASure was attempted expecting TRIG SOUR to be set to IMMediate 220 Parameter error Frequency list must be in ascending order Indicates that the frequencies entered using the MEMory ...

Page 134: ...l B has not been zeroed and calibrated then any command which would normally return a measurement result for example FETC READ or MEAS will generate this error message 230 Data corrupt or stale Please zero Channel A When CAL 1 2 RCAL is set to ON and the sensor currently connected to Channel A has not been zeroed then any command which would normally return a measurement result for example FETC RE...

Page 135: ...ximum range 231 Data questionable Lower window log error This indicates that a difference measurement in the lower window has given a negative result when the units of measurement were logarithmic 231 Data questionable Upper window log error This indicates that a difference measurement in the upper window has given a negative result when the units of measurement were logarithmic 231 Data questiona...

Page 136: ...eturning it for repair 310 System error Sensor EEPROM Read Failed unknown EEPROM table format This indicates a failure with your E Series Power Sensor Refer to your power sensor manual for details on returning it for repair 310 System error Sensor EEPROM data not found or unreadable Where refers to the sensor data block covered for example Linearity Temp Comp temperature compensation This indicate...

Page 137: ...ch sends data to the output buffer but the output buffer contained data from a previous command the previous data is not overwritten The output buffer is cleared when power has been off or after RST reset command has been executed 420 Query UNTERMINATED The power meter was addressed to talk that is to send data over the interface but a command has not been received which sends data to the output b...

Page 138: ...s Modular Power Meter Service Guide To clean the power meter disconnect its supply power and wipe with a damp cloth only For all voltages the power meter uses a 250 V F3 15 AH 20 mm fast blow fuse with high breaking capacity Keysight part number 2110 0957 NOTE The power meter has an internal fuse If you suspect that this fuse needs to be replaced it must be done by trained service personnel Please...

Page 139: ...s on page 139 If you still have a problem please read the warranty printed at the front of this guide If your power meter is covered by a separate maintenance agreement please be familiar with the terms Keysight Technologies offers several maintenance plans to service your power meter after warranty expiration Call your Keysight Technologies Sales and Service Center for full details If the power m...

Page 140: ...ersonnel have access to complete records of design changes for each instrument The information is based on the serial number and option designation of each power meter Whenever you contact Keysight Technologies about your power meter have a complete serial number available This ensures you obtain the most complete and accurate service information The serial number can be obtained by interrogating ...

Page 141: ... product number could be manufactured in two different countries In this case the individual product serial numbers would reflect different country of manufacture codes The prefix also consists of four numbers This is a code identifying the date of the last major design change The suffix indicates an alpha numeric code which is used to ensure unique identification of each product throughout Keysig...

Page 142: ...alibration of all data stored in it The memory data erased includes the save recall states and power on last states The following procedure explains how to do this 1 Click the softkey 2 Click 3 Click 4 Click 5 If you are sure click the Confirm softkey 6 A pop up appears as shown in Figure 4 3 informing you of the status of the procedure Figure 4 3 Secure erase status pop up 1 of 2 Service Secure E...

Page 143: ...ng enough to accommodate the power meter and allow at least 3 to 4 inches on all sides of the power meter for packing material Surround the power meter with at least 3 to 4 inches of packing material or enough to prevent the power meter from moving in the carton If packing foam is not available the best alternative is SD 240 Air Cap TM from Sealed Air Corporation Commerce CA 90001 Air Cap looks li...

Page 144: ...4 Maintenance 144 Keysight N8262A User s Guide Mark the shipping container FRAGILE HANDLE WITH CARE to ensure careful handling Retain copies of all shipping papers ...

Page 145: ...ower Meter User s Guide 145 5 Characteristics and Specifications For the characteristics and specifications of the N8262A P Series Modular Power Meter refer to the datasheet at http literature cdn keysight com litweb pdf 5989 6605EN pdf ...

Page 146: ...5 Characteristics and Specifications 146 Keysight N8262A User s Guide THIS PAGE HAS BEEN INTENTIONALLY LEFT BLANK ...

Page 147: ...t to change without notice Always refer to the English version at the Keysight website for the latest revision Keysight Technologies 2007 2017 Edition 4 August 4 2017 Printed in Malaysia N8262 90001 N8262 90001 www keysight com ...

Reviews: